
Are We in a Bubble?
Is the historic bull market on its last legs?

Disclaimer: This is not financial advice. Do your own research.
I am virtually 100% invested in the market. Every spare dollar I get my hands on still goes toward equities. I don’t own any shorts or puts, and I’m not trying to scare anyone with this article. I know it won’t be popular, but for my 1,000 readers I thought the right thing to do was lay it out honestly. Long term I agree with Warren Buffett, “Never bet against America.” But in the short term (1-10 years or so) I think there might be some trouble.
Background
In my short 13-year investing career, I’ve always been a bull. When people asked me for advice, I told them that unless they were willing to spend thousands of hours learning how to invest, they were better off just buying the S&P 500 index every month and forgetting about it. Recently I’ve felt myself turn into a bear. To tweak the famous Batman phrase: You either die a bull, or you live long enough to see yourself become a bear.
I’m a value investor. I learned everything I know from the greats: Buffett, Munger, Fisher, Graham and many more. I spend my time digging through 10-Ks and, more importantly, thinking about what a business will look like 5 to 10 years down the road.
I don’t typically spend time on macro items. In fact I’ve never written a macro-focused piece before today. But the setup we’re looking at right now is too important to ignore.
First I’ll talk about the record bull market we’re riding. Then we’ll look at the data and I’ll tell you whether I think we’re officially in a bubble.
The Record Bull
There are a lot of definitions for a bull or bear market. But if you look at the last 150 years of stock market data you can map out the large secular bull and bear periods that define it. As you can see in the graph below, if we finish the year on a positive note this will be the longest bull market in United States history at 17 years. The market averaged -4.5% real returns from 2000 to 2008. Since then it has returned 12.6% after inflation from 2009 through 2026.
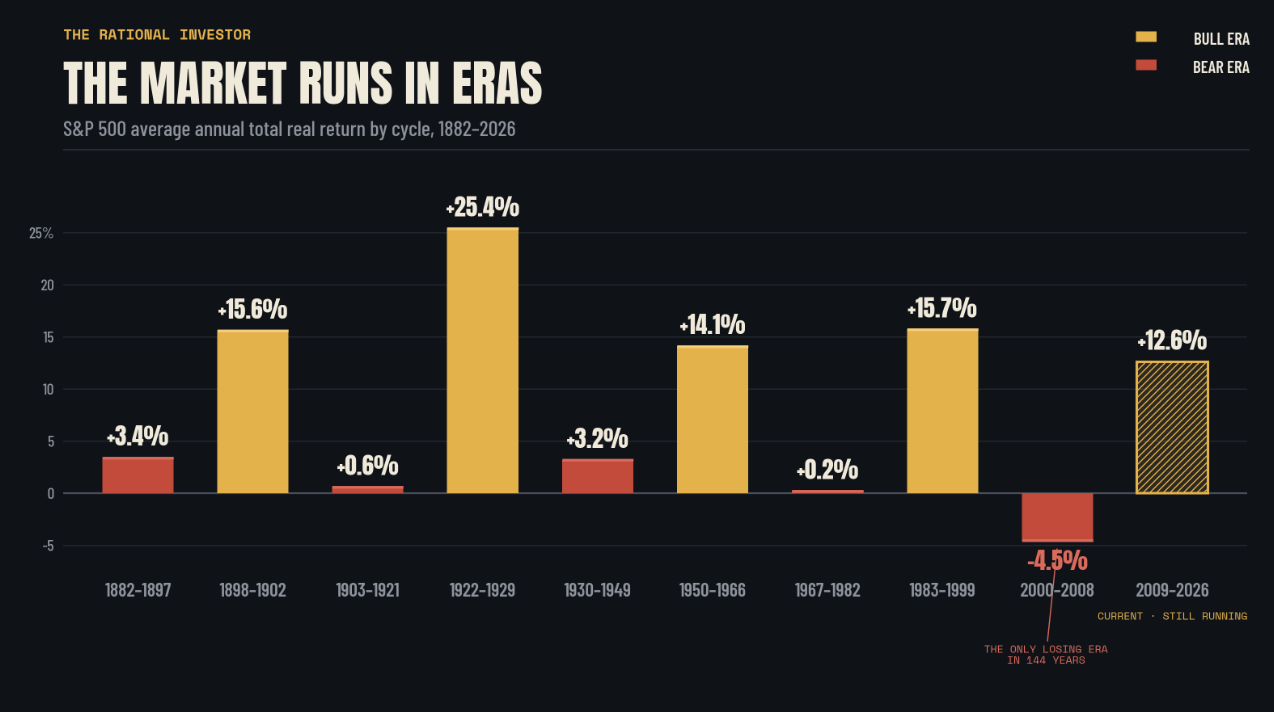
It’s not a question of if the bull dies, it’s when. The market can’t stay at this pace forever. Herbert Stein said it best: “If something cannot go on forever, it will stop.” Excluding dividends, the S&P has grown from $865 to $7,710 since 2009. That’s a 791% return, or 13.3% a year.
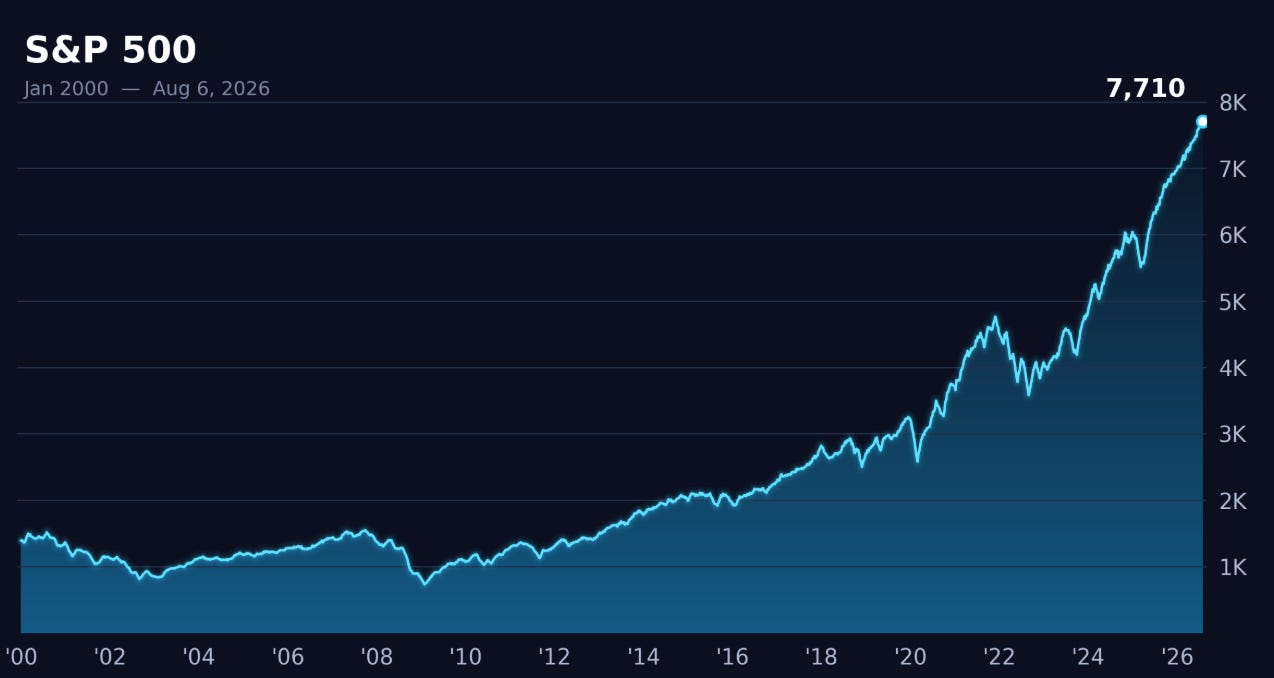

This has been an incredible growth story. Let’s look at where the growth came from.

Revenue per share grew only 4.3% a year while earnings per share grew 8%. That gap is the result of record high profit margins.
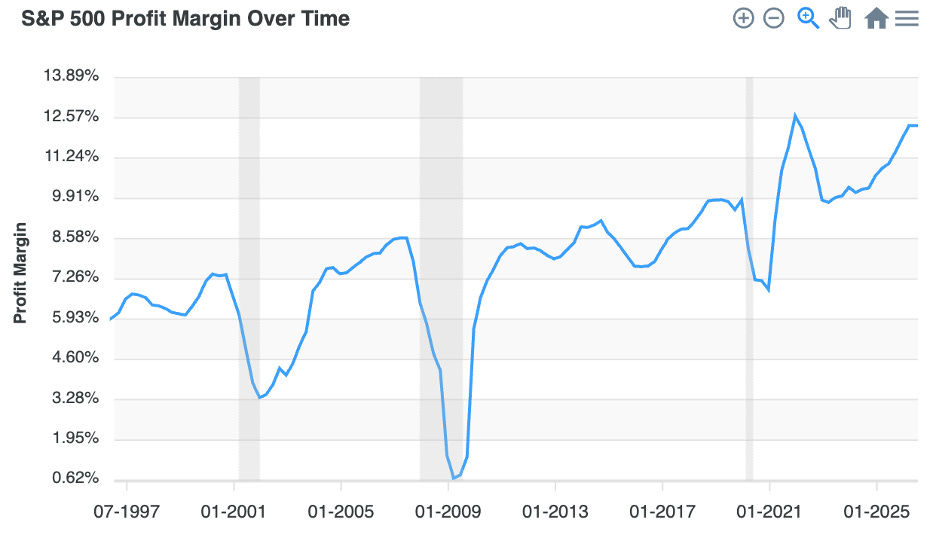
So earnings per share grew 8% a year while the market grew 13.3%. The rest of that gap is purely the mood of an emotional man named Mr. Market. In 2009, and rightfully so, Mr. Market was upset about current affairs and imagined a grim future. The market was trading at less than 11 times earnings (I’m using a normalized earnings number here. 2008 and 2009 had abnormally low earnings thanks to something called the Great Recession, and I didn’t want to skew the data). Today Mr. Market is euphoric, sees brighter days ahead, and the market trades at 29 times earnings!
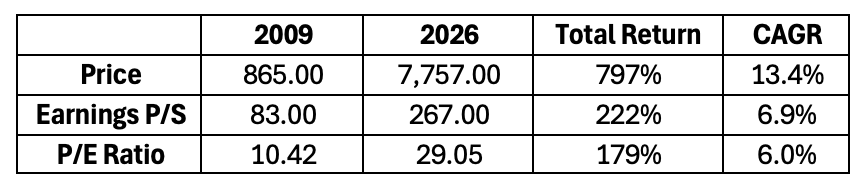
From the chart above you can see almost half the growth in the S&P has come simply from Mr. Market’s mood. People are far more optimistic about the future than they were 17 years ago.
Earnings Yield
A rising market is fun while it lasts. But the higher it goes, the less you get for every dollar you invest.
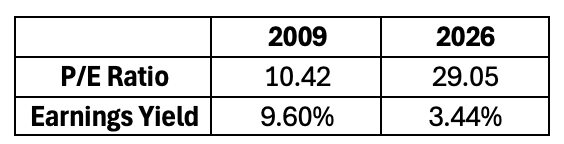
In 2009, for every $100 you put into the S&P you were getting $9.60 of earnings. Your money was earning 9.6%, and you could expect that to grow a little each year. And it did. You earned 13.4% plus dividends for a total return of 15.4%. 2009 was a great time to buy. Buffett even took out a newspaper ad titled “Buy American. I Am.” Fast forward to today and that yield is down to just 3.44%. You can still expect the S&P to grow EPS over time, so you’ll probably beat 3.44% over the long haul, but your near-term returns (0 to 15 years) are in the hands of a manic-depressive maniac named Mr. Market. Investors are hoping he stays manic forever.
This is a concept a lot of people don’t grasp. I constantly hear friends and people online say “It’s only trading at 25 times earnings!” about a giant company that will struggle to grow more than 10 to 15% a year. If you pay 25 times earnings for a stock, that thing better grow, and grow fast. I’d want 20 to 30% growth for many years.
Food Truck
An easier way to think about it is buying the local food truck. Say you had the chance to buy one for $100K. How much profit would you want it to have earned the year before? Probably at least $10K, and you’d want to be confident that income would grow over the years. That’s a 10% earnings yield.
Would you pay $100K for a food truck that earned $3.4K last year? Probably not. What if you also knew its revenue had grown just 4% a year over the last 17 years? Now it’s a hard no. That is exactly what investors are paying for the S&P: a 3.4% earnings yield.
What kills the Bull?
Our record bull market will end at some point and it’s likely on it’s last legs. The question is what kills it and when. No one knows. Euphoria can last a long time. People called the dot-com crash back in 1996 and it went on another four years. Plenty of things could end it: the economy, the housing market, consumer debt, the AI buildout, unemployment, or just a loss of confidence. I’m going to focus on one, and it’s the reason I’m writing this article…… Bonds are back.
When I started investing 13 years ago the advice was simple for anyone who wanted to own stocks without putting in the time to learn how to value a business. Buy a low-cost index fund that mirrors the S&P 500 and invest in it every month. That advice worked beautifully. If you’d invested $1,000 a month and reinvested the dividends over the last 13 years, you’d have $440K on $156K invested. That’s a CAGR of just under 15%, outperforming most professional money managers.
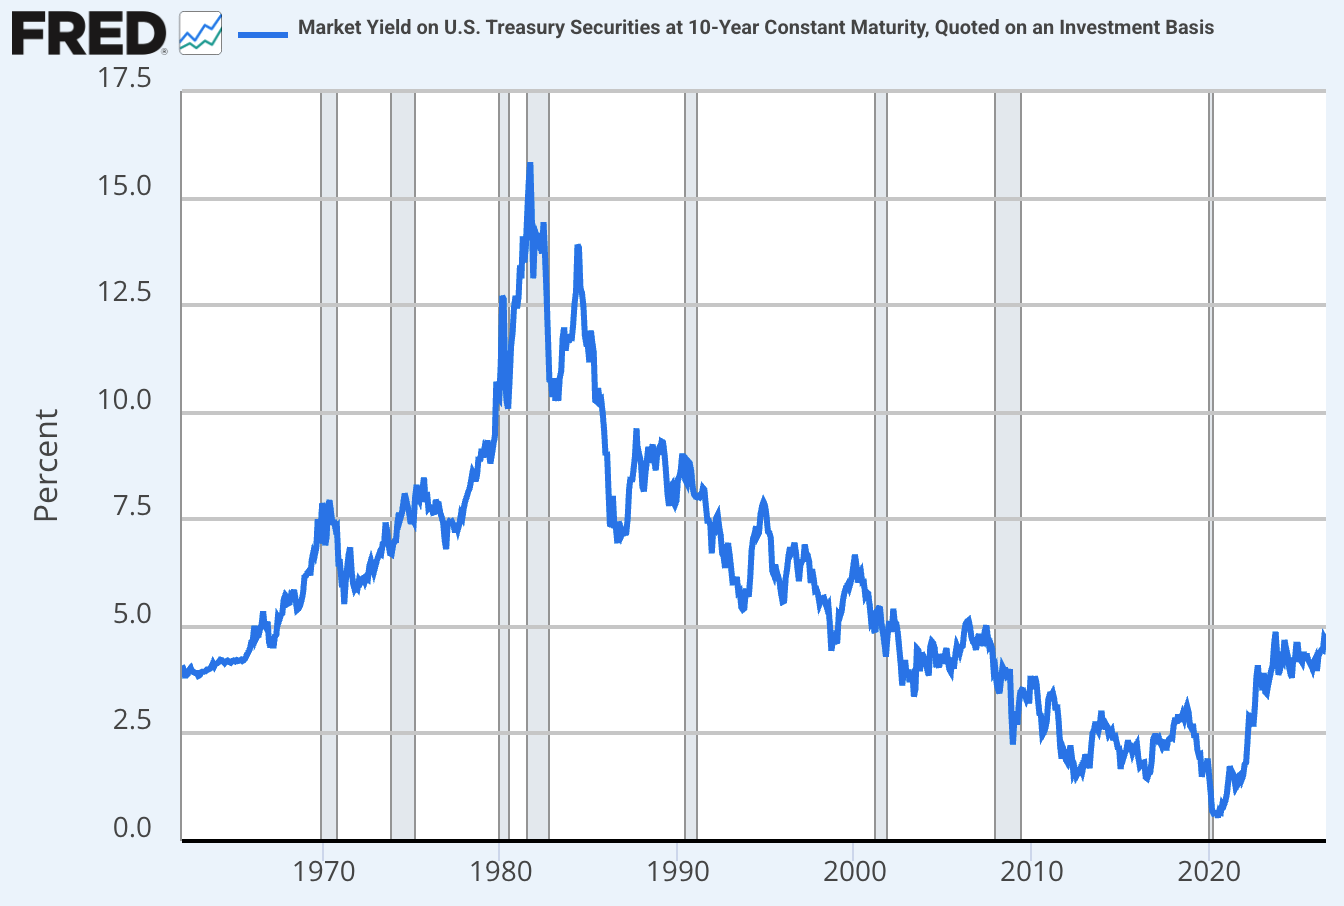
Back then it was easy advice because there was no alternative. From 2009, the start of the bull market, the 10-year treasury sat under 4% and most of the time under 3%, falling to 0.5% during Covid in 2020. It didn’t cross 4% until 2022 and has hovered there since, recently hitting 4.7%, with the 30-year treasury touching a 19-year high of 5.2%.
If stocks were trading at a 9% earnings yield, a 5% bond still wouldn’t be tempting. But with the earnings yield down to 3.4%, that bond becomes a real option. Long term (20 years and out) I think the S&P beats a 5% bond. But in the near term (0 to 10 years) the bond will likely outperform for long stretches. Buffett said interest rates are gravity on asset prices, and he’s right. The 5% bond acts as an anchor on every other option out there. If you think your investment will return less than 5%, or even close to it, you just take the bond instead.
A 5% bond might not look that enticing next to stocks, but it puts real pressure on asset prices.
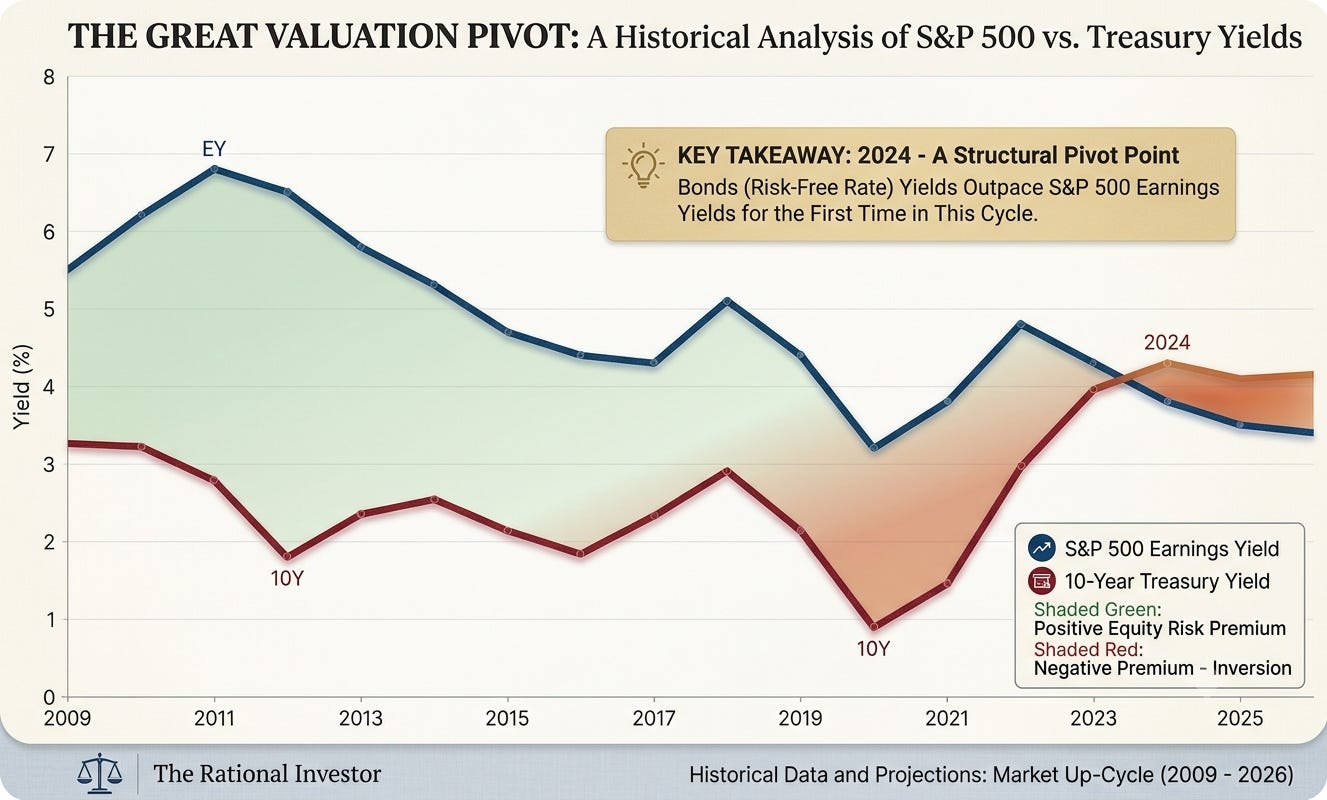
You can see that since 2009 the earnings yield far exceeded bond yields, which made stocks an easy choice. But since 2024 bond yields have been higher than the earnings yield. So what does that mean for stocks?
It means the already sky-high P/E ratio probably isn’t going much higher, and will likely contract at some point.
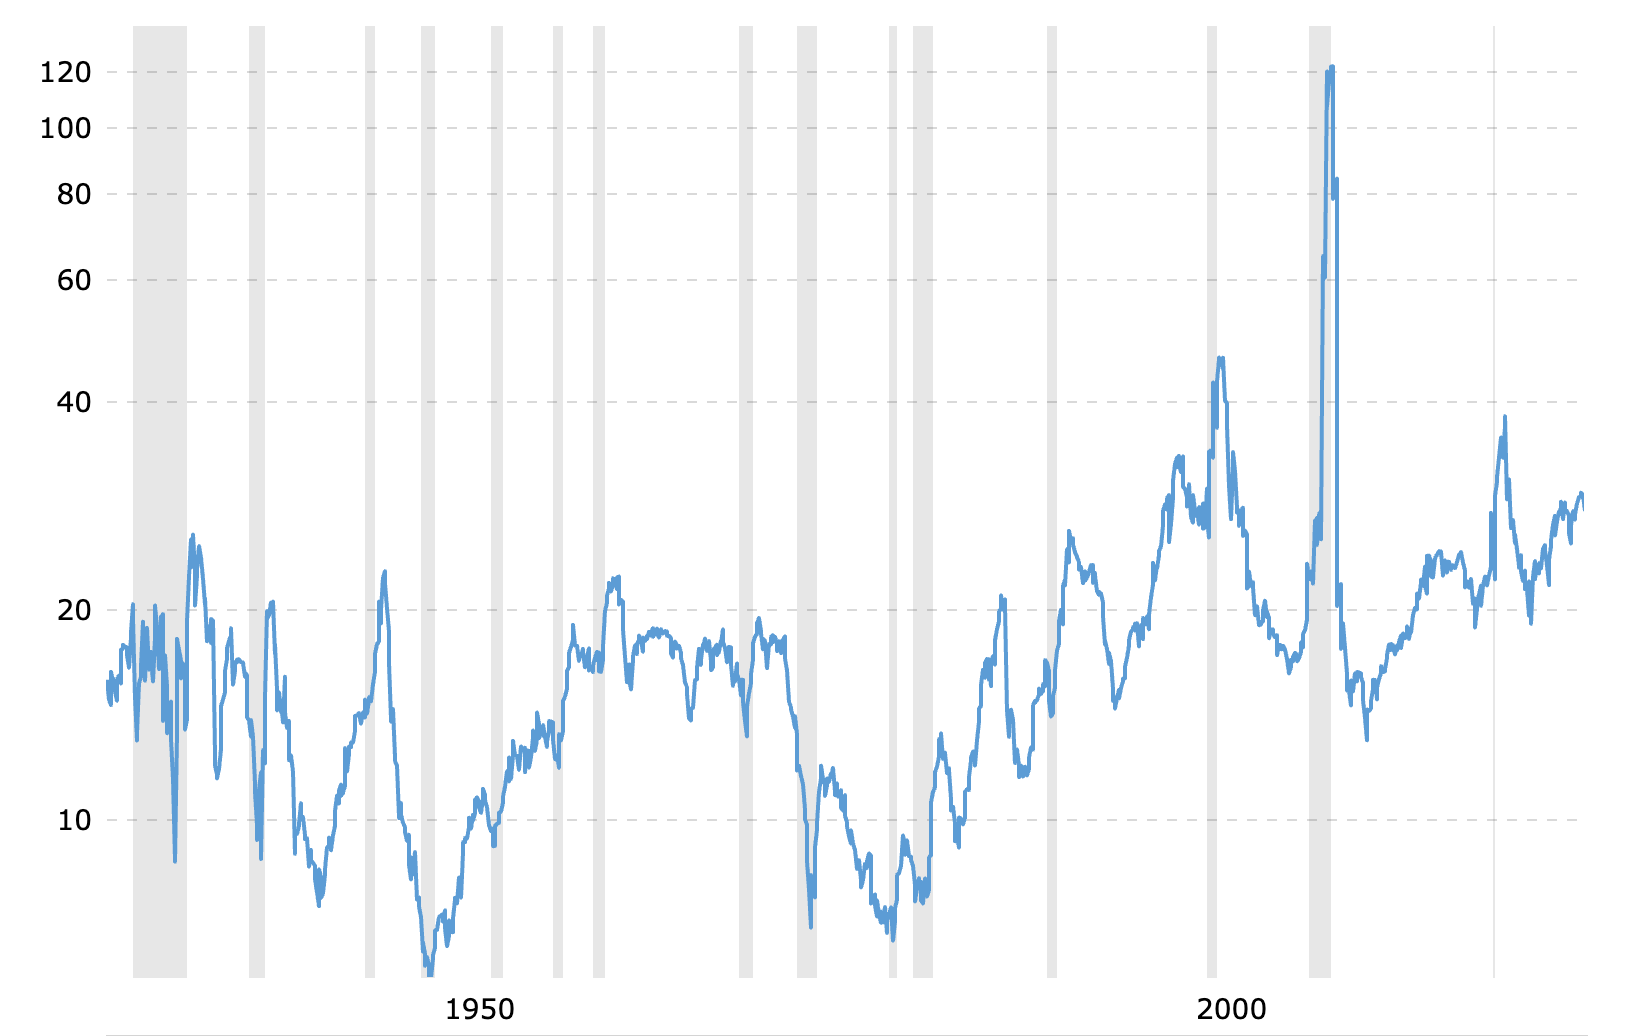
You can see across the history of the S&P 500 that our P/E ratio is near record highs. Zooming in on the last 30 years makes the picture clearer.
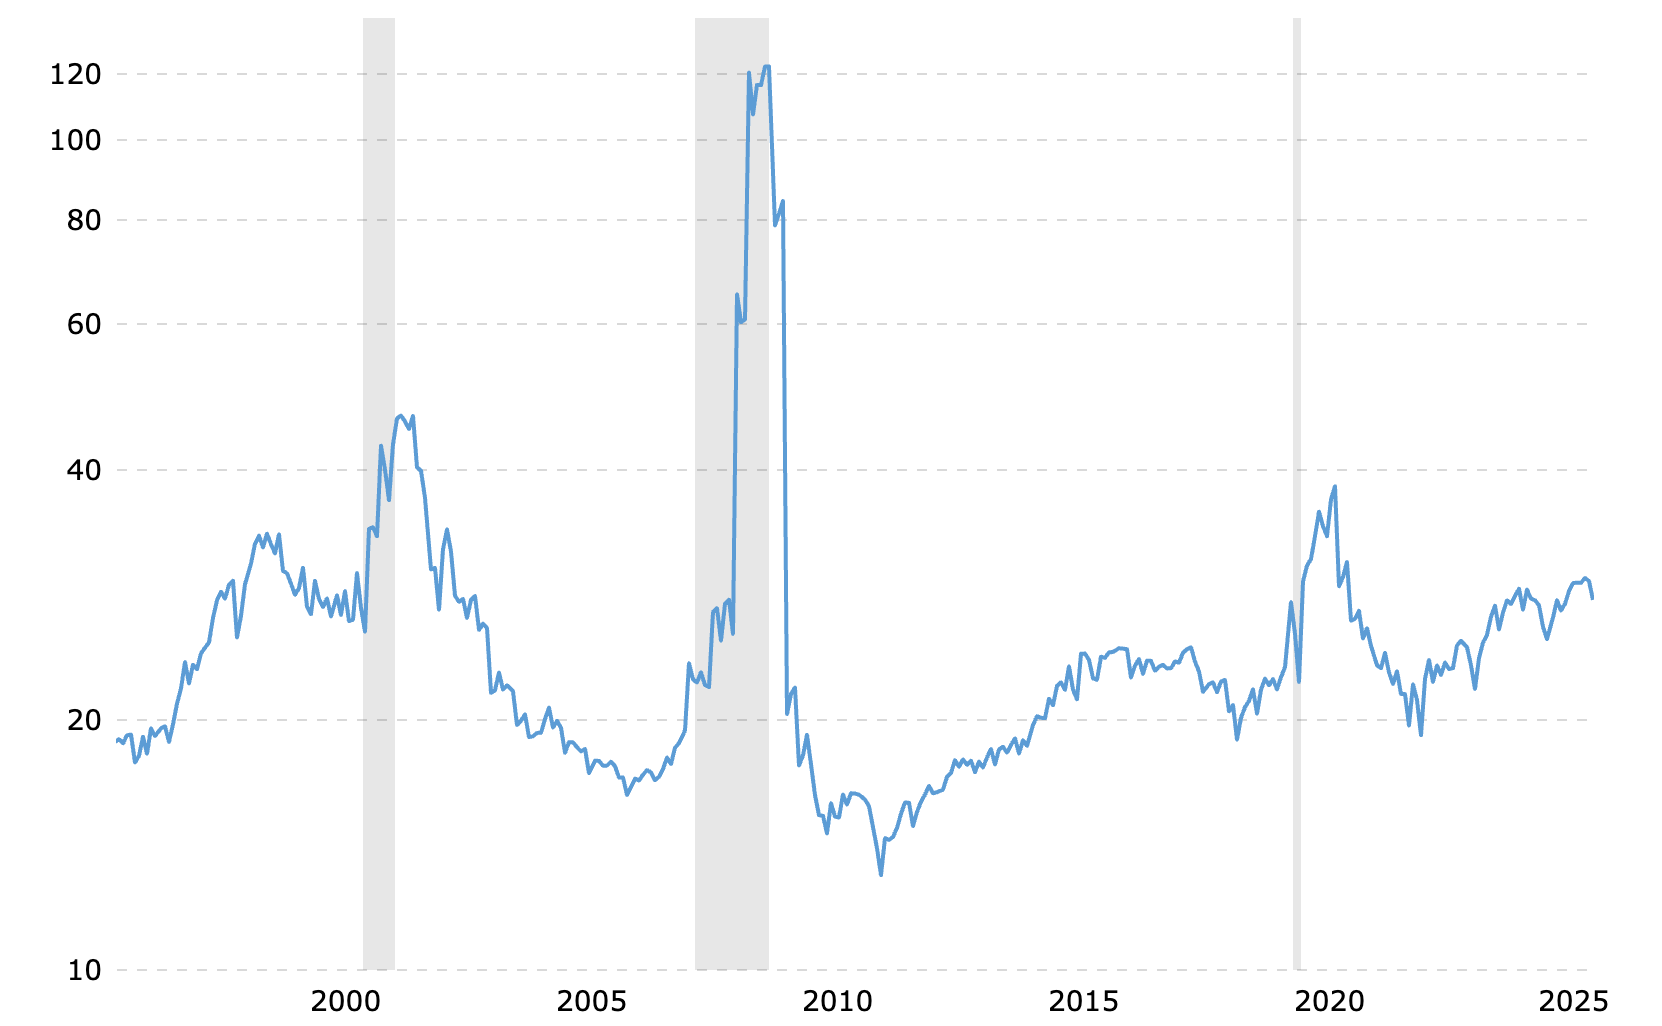
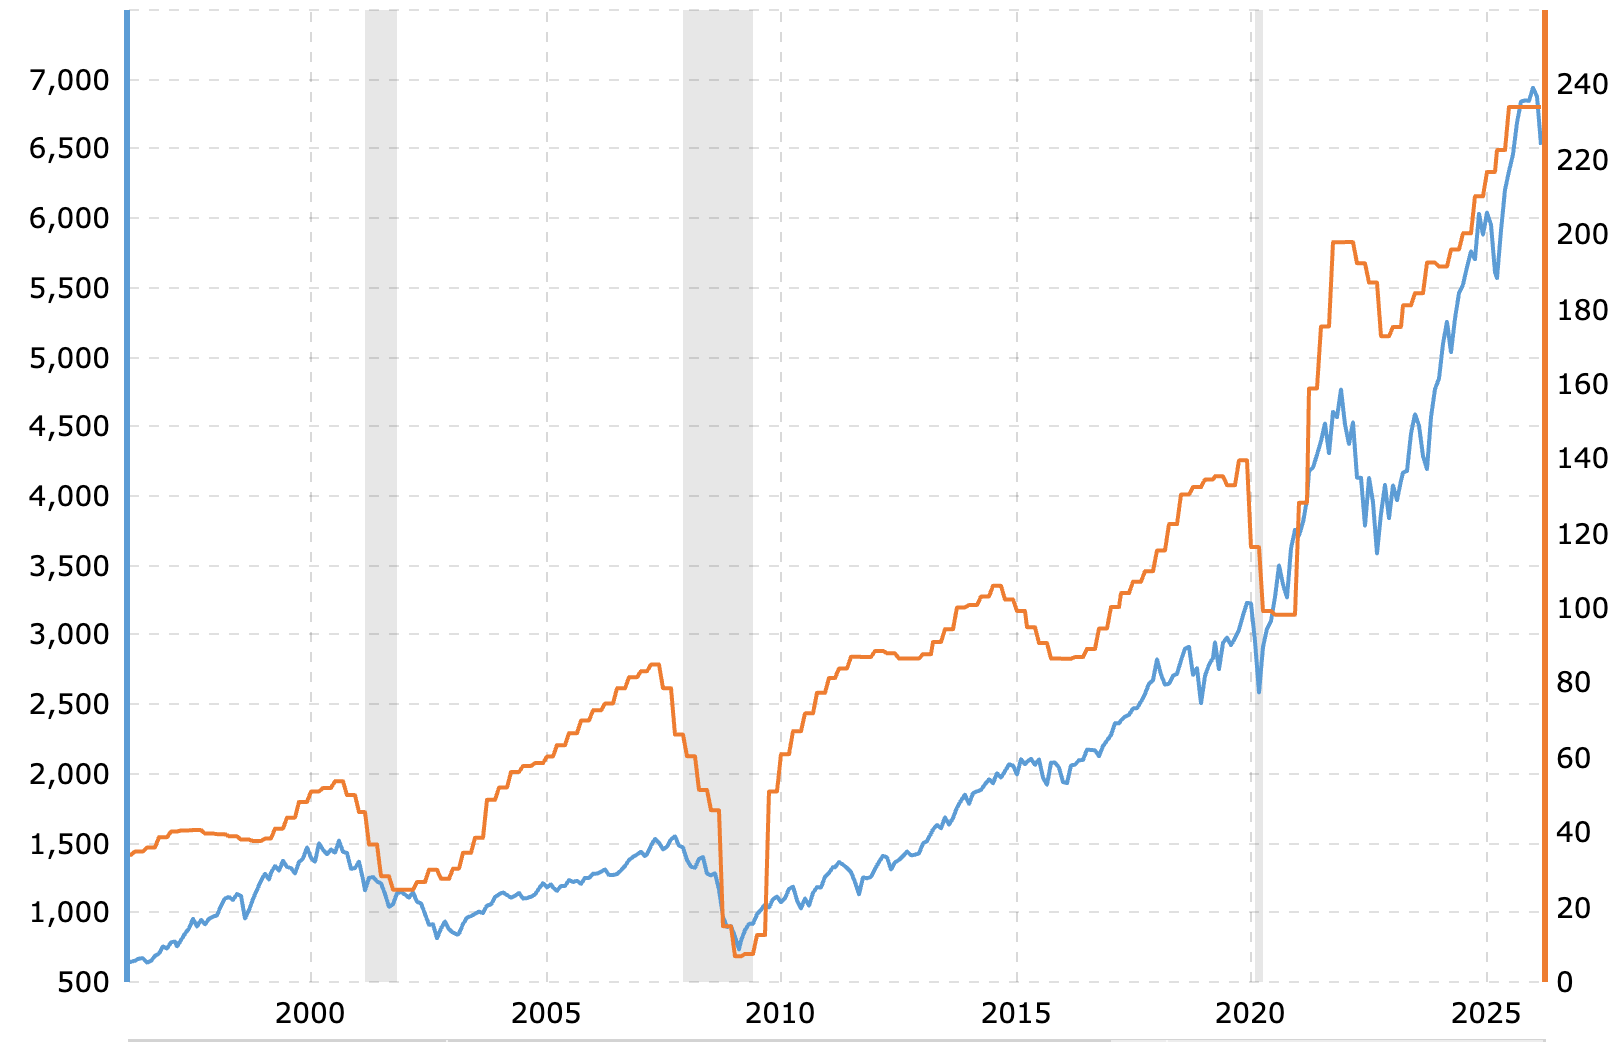
The grey bars are recessions, which push P/E ratios up because earnings fall so steeply. See the EPS graph below in yellow.
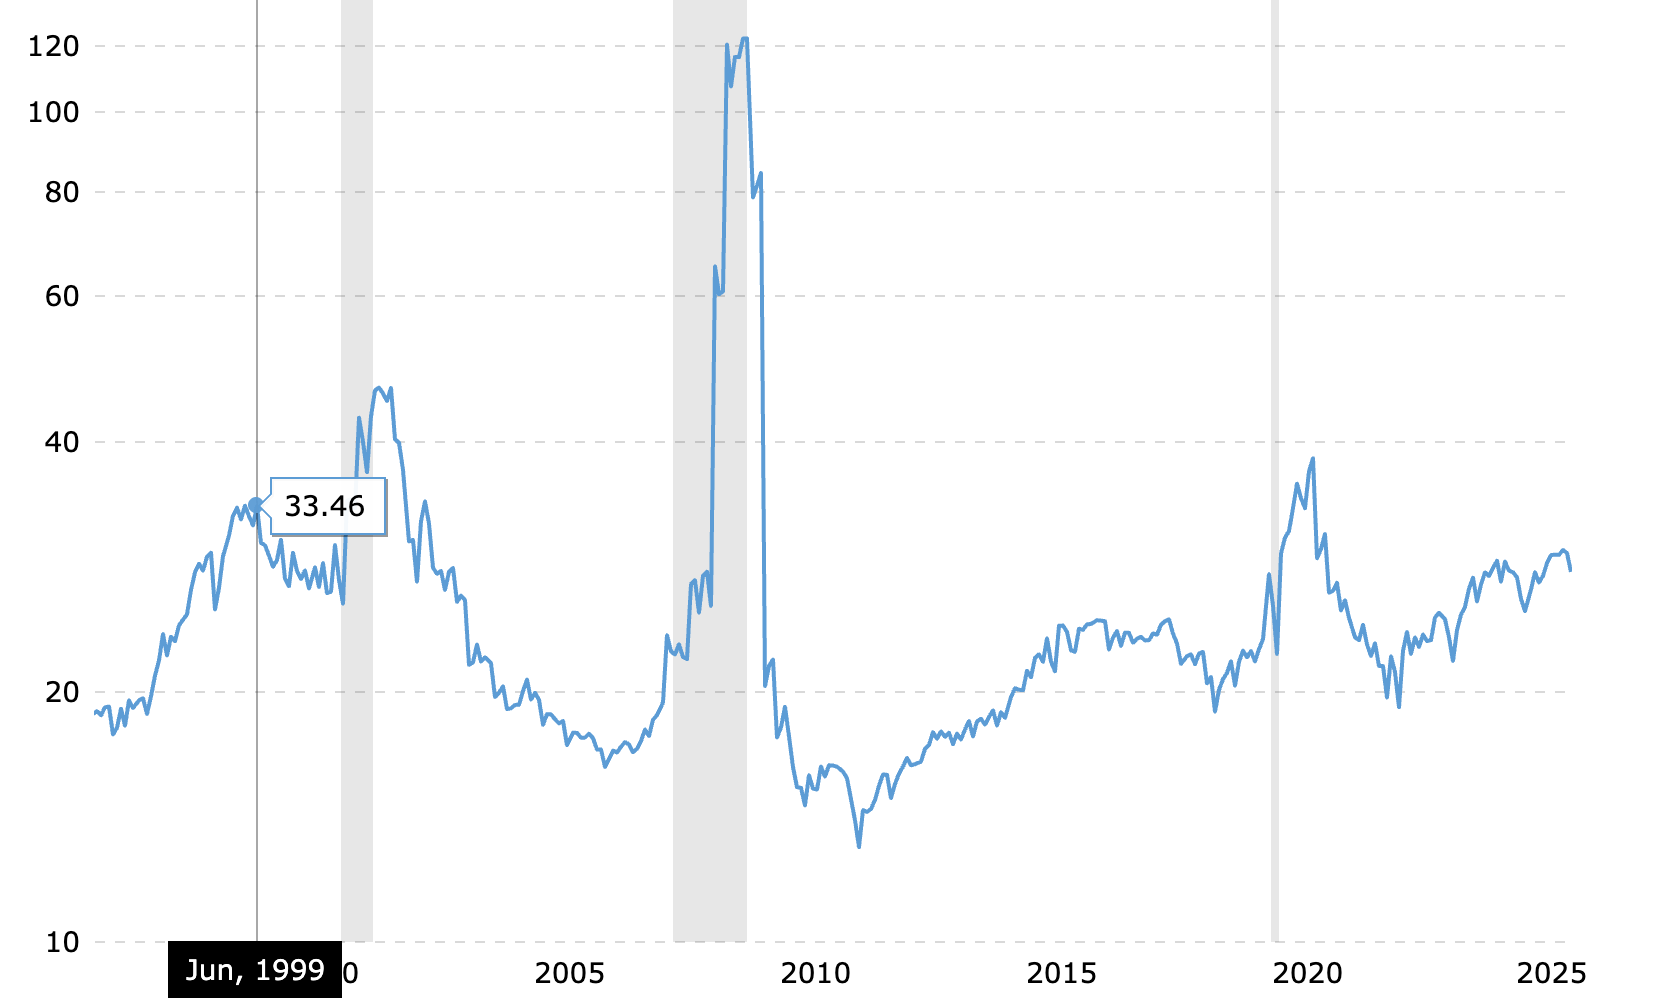
Exclude the recessions and P/E ratios have only been this high once: the dot-com bubble of June 1999, when they hit 33.46. The Nasdaq went on to fall 78% and the S&P 500 fell 48% from their dot-com peaks. Not great company to keep.
But let’s play devil’s advocate and say P/E ratios don’t collapse. “This time is different.” (It’s never different, and people say that line every time. Today they’re saying it about AI, datacenters, chip companies, and even space.) Even if the P/E ratio doesn’t collapse and stays at record highs, there’s still a problem.
The price of any stock is simply EPS multiplied by the P/E ratio. The P/E ratio is unlikely to rise much from here, so the market’s entire gains from this point have to come from growth in EPS.
EPS breaks down into revenue and profit margin. And as I showed earlier, we run into some issues there


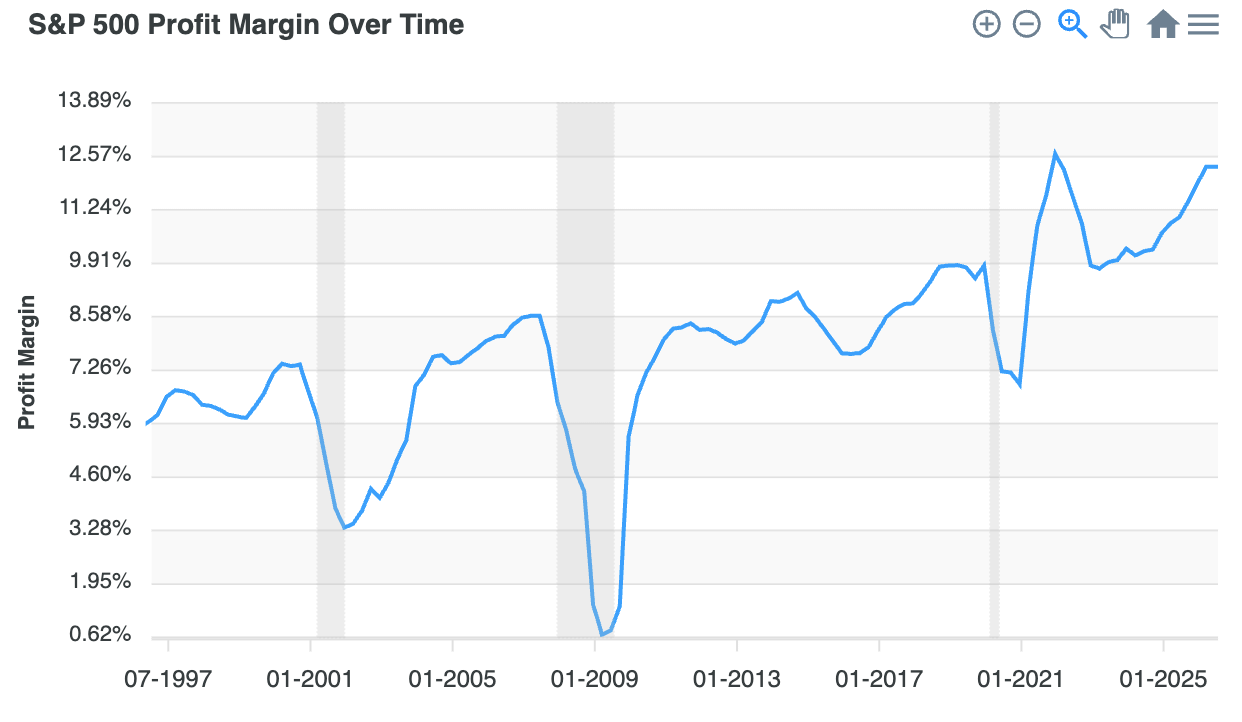
With profit margins at all-time highs, it’s fair to assume they come down. That leaves revenue per share as the source of future growth. Over the last five years the highest 10-year revenue-per-share CAGR was 6.4%, and that includes buybacks, which do less and less as prices and ratios climb and companies can buy back fewer shares.
To summarize: future S&P 500 growth has to come from revenue per share, with a drag on top of it from lower margins and P/E contraction. Even if the AI buildout lands, expectations should be modest. The next 17 years will be worse than the last 17.
The Ticking Time Bomb
In a good scenario the market returns whatever revenue per share grows. But if Mr. Market’s mood sours, it gets ugly. At 29 times earnings, a contraction to just 25 is a 13% drop, and the market would still be expensive by historical standards. The earnings yield would still be just 4% while a bond pays 5%.
The scarier scenario is rates ticking up further. A 5% yield still isn’t that attractive, but what about 7, 8, or 9 percent? I was born in the last weeks of 1995. We have never seen a 7% bond yield in my lifetime. A 7% risk-free bond would get people’s attention.
Over the last 30 years regular people have come into the market through 401(k)s and retirement plans. The advice has been simple: invest in the market every month. Buffett has called a low-cost index that mirrors the S&P 500 the best long-term way to build wealth. I’ve given that same advice for 13 years. But now, as rates keep climbing, when does the retail investor get swayed by bonds? We’ve all heard the stories of the 14% bonds of the 80s and people wishing they’d snagged them. I have friends who’ve been scared of the market for the last decade and have sat mostly in 2 to 3% bonds. If yields keep rising, people start leaving equities for bonds. The amount of money Americans hold in equities is at an all-time high.
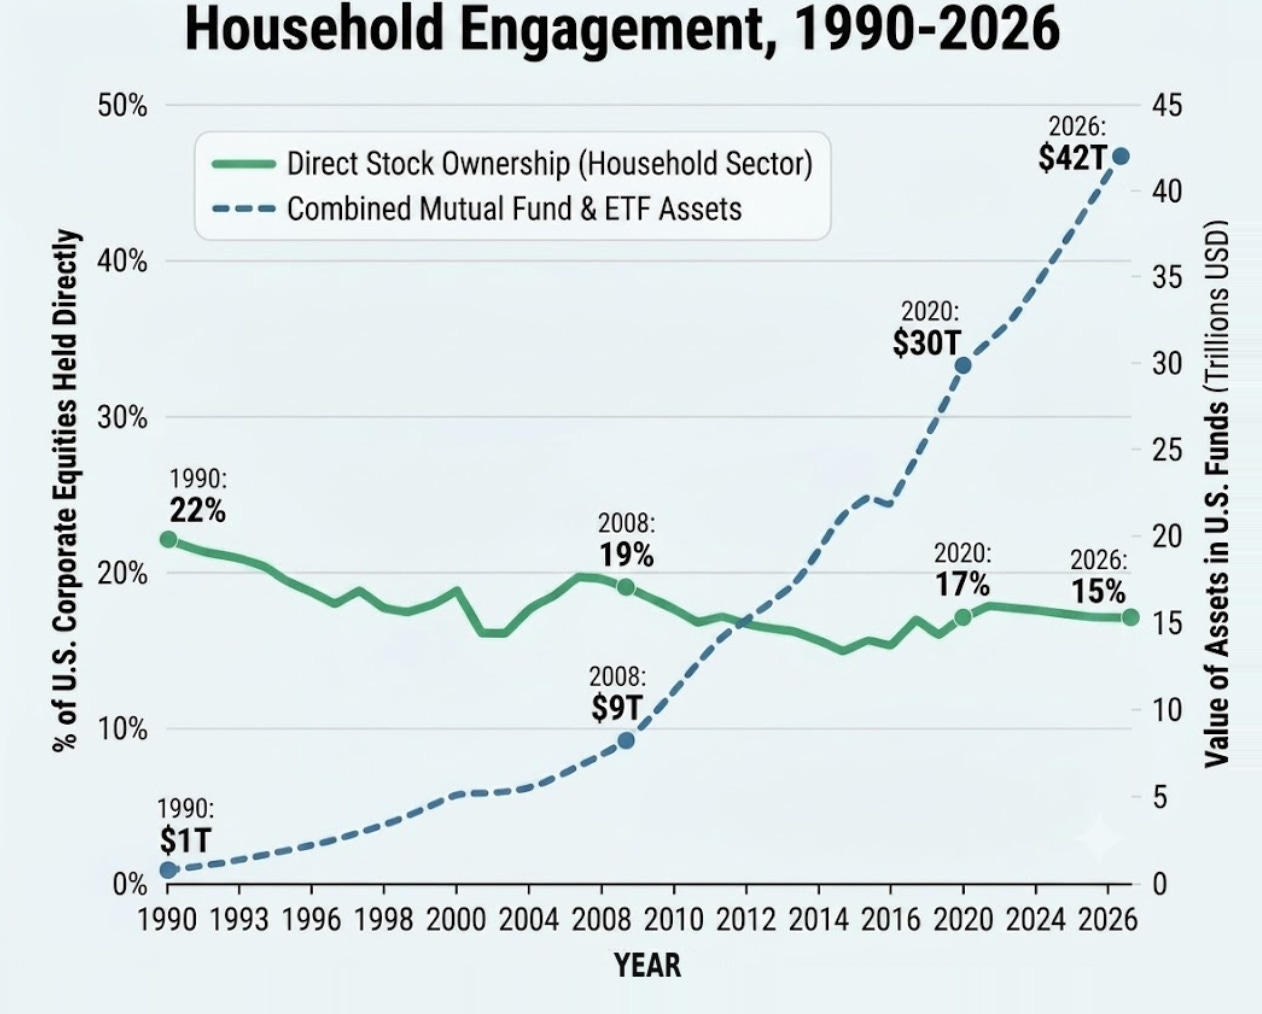
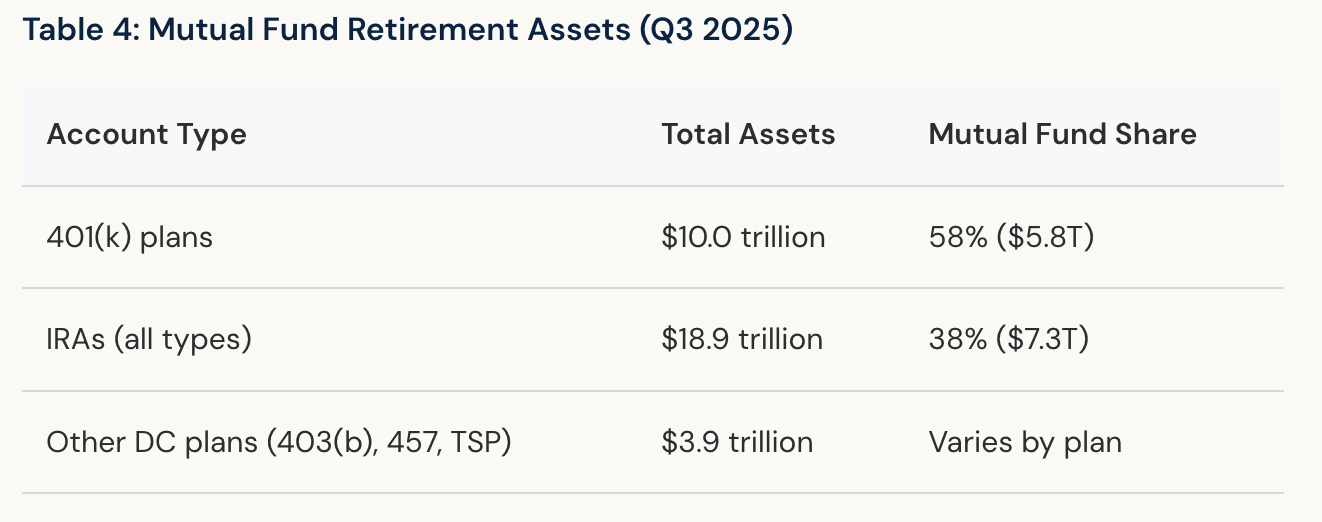
As 401(k) plans replaced pensions, equity ownership across the country exploded. That was a great thing for everyday people with easy access to the market (again, long term I think this is great for Americans who invest monthly). Today over $40 trillion sits in mutual and index funds, about half of the entire U.S. stock market. This is a ticking time bomb. If even a small 5 to 10% of it, $2 to $4 trillion, decided to leave the market in a short window, it would cause a serious and devastating crash. This hasn’t been much of an issue in my lifetime because there haven’t been alternatives. A risk-free investment yielding 7% or so is an alternative. This won’t necessarily be what kills this bull, but in my lifetime we are bound to have a serious problem here, and likely more than one. This is not a question of if but of when.
It has never been easier to change your investments. It takes about a minute to log in and switch your 401(k) from the S&P to a bond fund. No one knows when this might happen, but as Bill Seidman once said, “You never know what the American public is going to do, but you know they will do it all at once.”
Buying and Selling mechanics
With the total stock market at $71 trillion, $2 trillion might not sound that bad, just 3% or so. But it’s very hard to find buyers for that much money. Here’s a concept amateur investors and even financial reporters struggle with: when stocks go down it’s not because there were more sellers than buyers. For every sale there is a buyer, and vice versa.
If someone wants to sell 1 million shares, say that’s $5 billion, the price keeps falling until enough buyers show up. When a sudden flood of orders hits and the market can’t balance it, the stock gets halted, either to stop a run on it or to stop it from running up too fast. This is fairly common for individual stocks on volatile days, big earnings beats or misses, or a drug approval. The broader market has its own circuit breakers.
Level 1 (7% drop): Halts all equity and options trading for 15 minutes.
Level 2 (13% drop): Halts trading for 15 minutes (if triggered before 3:25 p.m. ET).
Level 3 (20% drop): Suspends trading for the rest of the trading day.
The last time this happened was March 2020 during Covid. Exact daily outflow numbers are hard to pin down, but roughly $330B was pulled from mutual funds and ETFs in March 2020 alone. In one month, from February to mid-March, the S&P 500 lost 34%. In the 2008 financial crisis about $110B was pulled from equities. Any mass run for the exit can do severe damage. The money in index and mutual funds has only exploded since then, putting the market at greater risk of a run.
There looks to be plenty of liquidity, with about $1 trillion traded a day in the U.S. market. But 70 to 80% of that is algorithmic, so only around $300B is actual people buying and selling. And since every buyer needs a seller, that’s really only about $150B of stock changing hands a day. Any big jump above that puts pressure on prices. Stocks will fall forever until someone buys.
There’s no magic to the $2 trillion I keep referencing. I use it because it’s tiny relative to what’s invested, and yet on its own it could trigger a massive sell-off. No one knows exactly what would happen, and that’s what makes being in the market so fun. It could be much more than $2 trillion. Here are a few more stats.
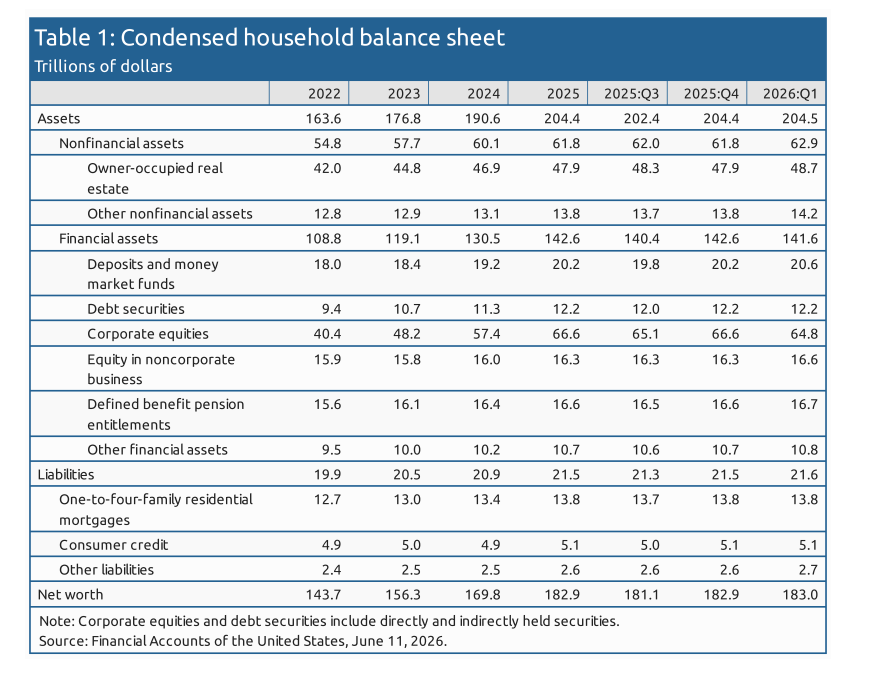
U.S. households alone hold $65 trillion in equities.
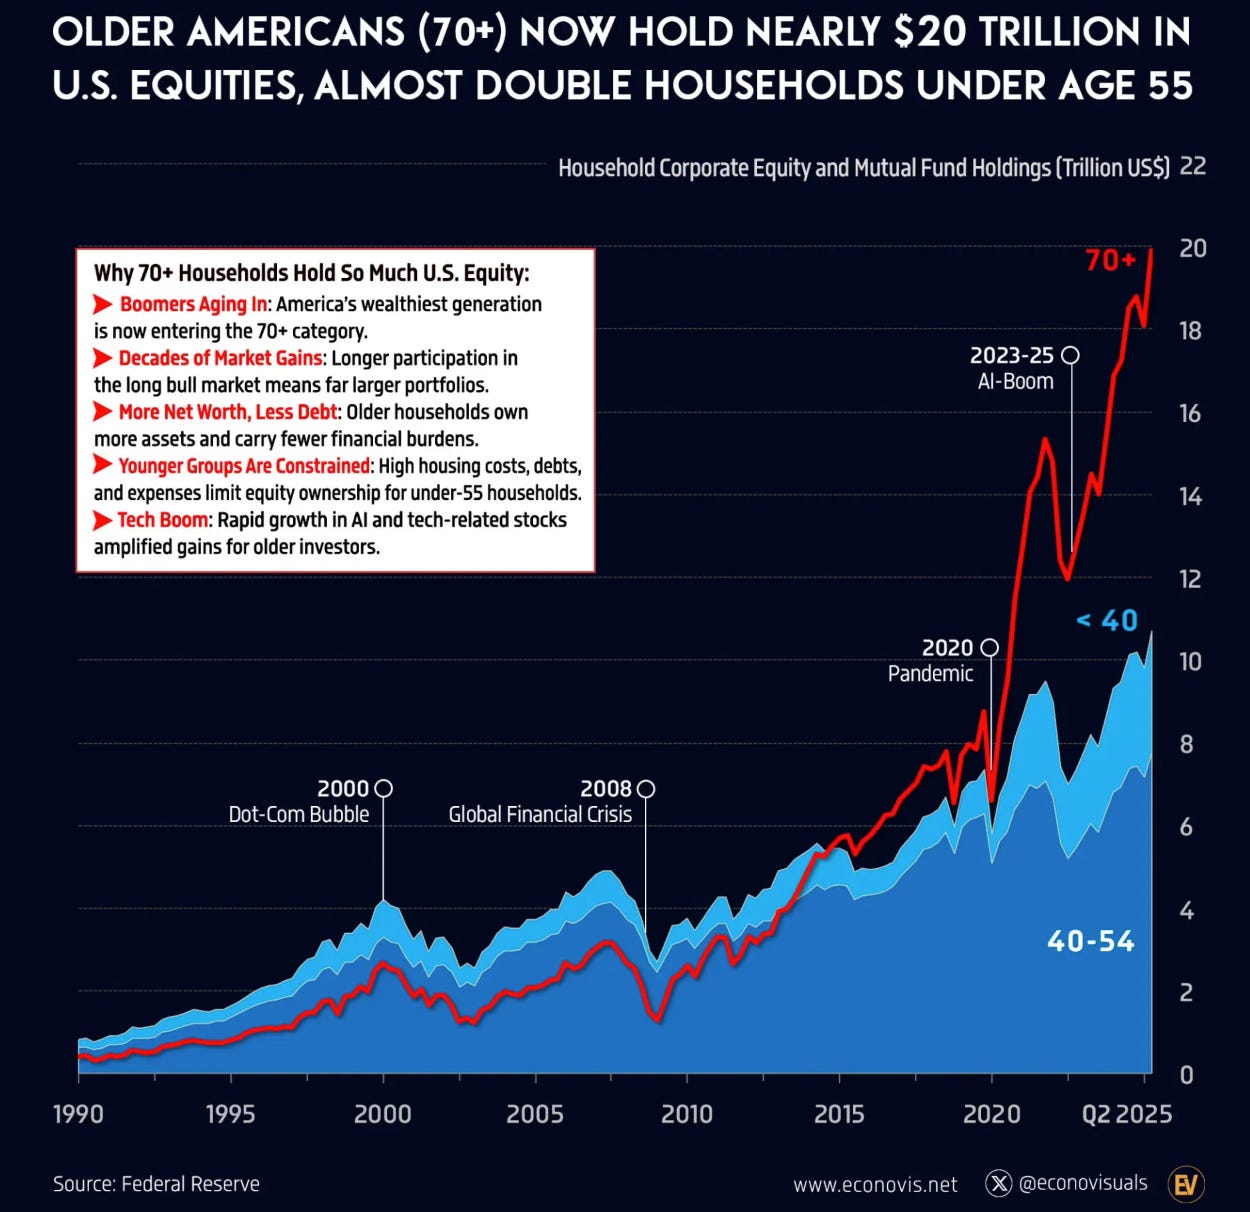
Americans over the age of 70 hold over $20 trillion in the market alone. These are senior citizens who’d love a nice big bond to protect the nest egg they worked their whole lives for.
I’m surprised this isn’t talked about more.
How low can it go?
The S&P 500 could fall drastically. Easily 50%. I know some of you don’t believe that number because stocks just seem to go up. But the S&P lost 49% in the dot-com crash, 57% in the financial crisis, and 35% in a single month during Covid. Let’s look at some math.
Let’s build a table with the 10-year treasury at 5 to 8%, and assume stocks trade at a 1% discount to that, so a 6 to 9% earnings yield.
For earnings, let’s assume the AI buildout goes great and EPS jumps 12% from today, from $267 per share to $300 (it could be a lot worse, but I want a conservative table).
Current S&P 500 price: $7,757.

This is why so many investors who have been around a long time are worried. Even in a good scenario stocks are expensive and a massive drop is possible. I know people think “this time is different” and P/E ratios would never get that low. But the S&P’s median P/E is 15 and the mean is 16. In 2013 it traded under 14. Apple sold for 10 to 12 times earnings in 2015 and 2016. If one of the greatest companies on the planet can sell at 10 times earnings, so can the market. Crazy things happen all the time. This table is a simple illustration of why a 13-year bull like me has turned into a bear.
And remember, that’s the good scenario. Imagine the AI buildout fails, we fall into a recession, and inflation doesn’t cool. An S&P in the 2,000s is not off the table. I once had 90%+ of my portfolio in DKS, and the odds of the S&P hitting the 2,000s are far higher than the odds I’d have lost money in DKS at $80 a share. I won’t get into the AI buildout itself. Plenty of people understand it and explain it better than I can, one of them being Michael Burry, who is currently shorting and buying puts on it.
A quick point on interest rates in general. Rates will keep rising until inflation cools. If inflation cools, rates likely steady or come down. If inflation keeps rising, the 10-year and bonds in general are likely to rise with it.
The Dying Bull Overview
I said a lot and rambled on there but to summarize my general thoughts in two points.
1. Even in a perfect scenario where the economy keeps rolling, the AI buildout lands, and P/E ratios stay high forever, the S&P 500 is destined to return whatever its revenue per share averages. The highest 10-year CAGR over the last five years is 6.39%. Expectations should be modest at best.

2. If bond yields get high enough to pull capital out of the market, it could cause a rush for the exits. Valuations are high, and even a return to merely modest valuations means a severe drawdown.

Neither scenario even requires an economic slowdown, which would only amplify the losses.
On August 10, 2026, the S&P 500 closed at $7,753. I believe there will be many stretches over the next 10 years where a 5% bond beats the market from today’s level. That said, I’m still fully invested, though over 80% of my portfolio is in Sweden. Even if my capital were tied to the United States I’d still be fully invested, since I run a small enough amount to find plenty of places to put it.
If I were trying to retire and needed the money, I would not keep my next 10 years of expenses in the market. I’d put it in a bond. Long term the market will likely beat bonds, but short term, over the next 0 to 10 years, bonds are intriguing. Now let’s answer the question. Are we in a bubble?
Are We in a Bubble?
People will argue both sides of this. I’m not going to give an elaborate, detailed answer. I’m just going to make observations and show graphs and data. My opinion is yeah, probably. When will it pop? Who knows. It feels eerily similar to the dot-com crash, with people saying very similar things. The difference is that some of today’s companies are fundamentally stronger than a lot of the dot-com names, all while being extremely overvalued.
What others are saying
Don’t take it from me. Take it from the experts.
Warren Buffett
My idol. I trust him more than I trust myself. When he stepped down as CEO he was sitting on $400 billion in cash because he couldn’t find anything useful to do with it. He can only move the needle with really large investments, so his universe is far smaller than the average investor’s, but still.
In a recent interview he said, “So we’ve never had people in a more gambling mood than now. But that doesn’t mean that investing is terrible. It does mean that prices for an awful lot of things will look very silly.”
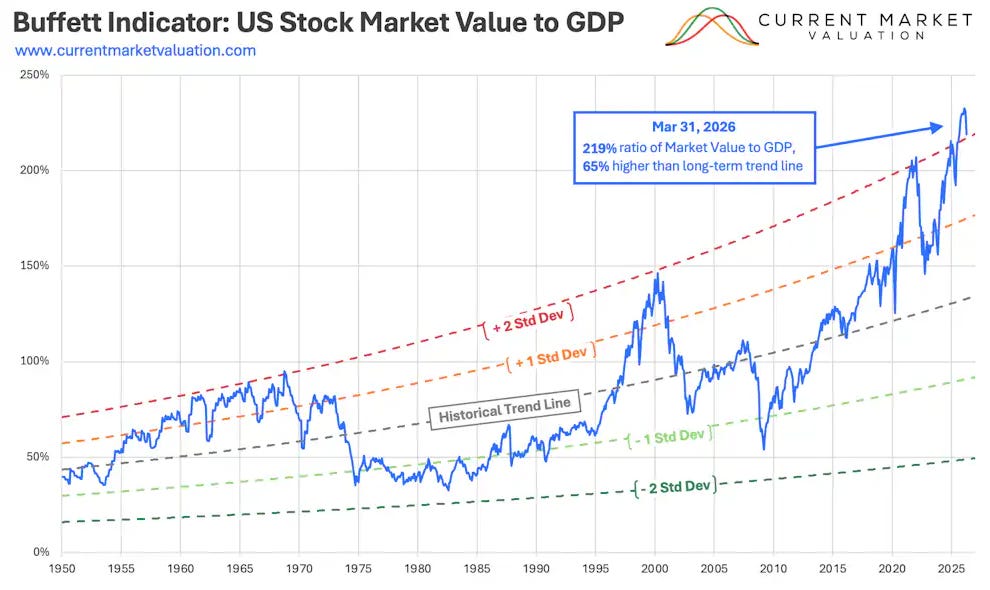
From that I think it’s fair to assume he believes stocks are overvalued. The Buffett indicator, U.S. market cap to GDP, is also at an all-time high.
Ray Dalio
Ray Dalio recently agreed with Jeremy Grantham’s statement that we’re in “the biggest bubble in American history.” He believes the enthusiasm for AI has pushed the market into bubble territory, and that this looks a lot like the run-ups to the crashes of 1929 and 2000.
Jeremy Grantham
Grantham called the 2000, 2008, and 2021 bubbles. He’s recently called today’s market the most overvalued in history and would advise staying out of U.S. stocks. He’s also called it a bubble within a bubble.
Probably the most famous short seller. He correctly called the 2008 housing crash. He’s currently shorting and buying puts on companies in the AI space. He recently said PLTR was worth less than $1. If you’re interested, his Substack gets into the circular financing and accounting shenanigans going on. He explains the AI business much better than I can. He’s the only Substack I pay for. Highly recommend.
I could go on and on, but you get the point. A lot of market veterans think we’re in a bubble.
Now some graphs and data.
Data Overload
Dot Com Bubble Stocks

Today
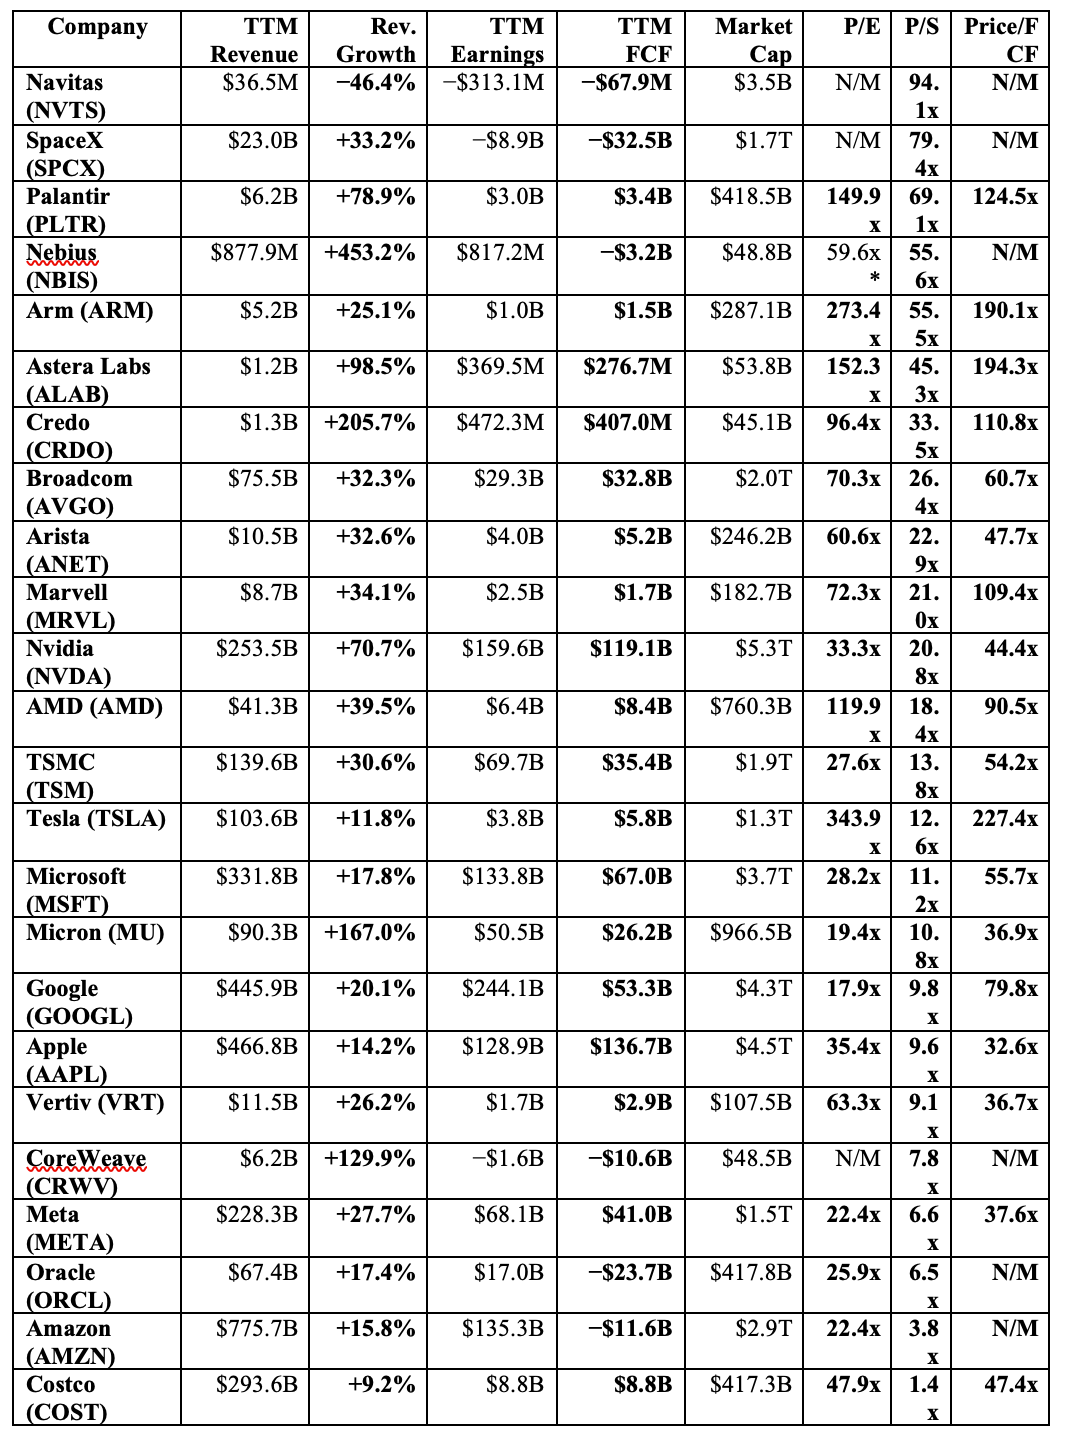
On price to sales and price to earnings, we don’t look as overvalued as the dot-com bubble, even if some individual prices are insane. But on free cash flow it’s much scarier. Everyone is throwing the kitchen sink at the AI buildout, and if it doesn’t work some companies are in real trouble. Google, Amazon, and Microsoft can piss away hundreds of billions and be fine. Most companies cannot. A lot is riding on everyone continuing the party. One problem is that Chinese AI models are getting very good, and even if they aren’t quite as good, which is debatable, they’re much cheaper.
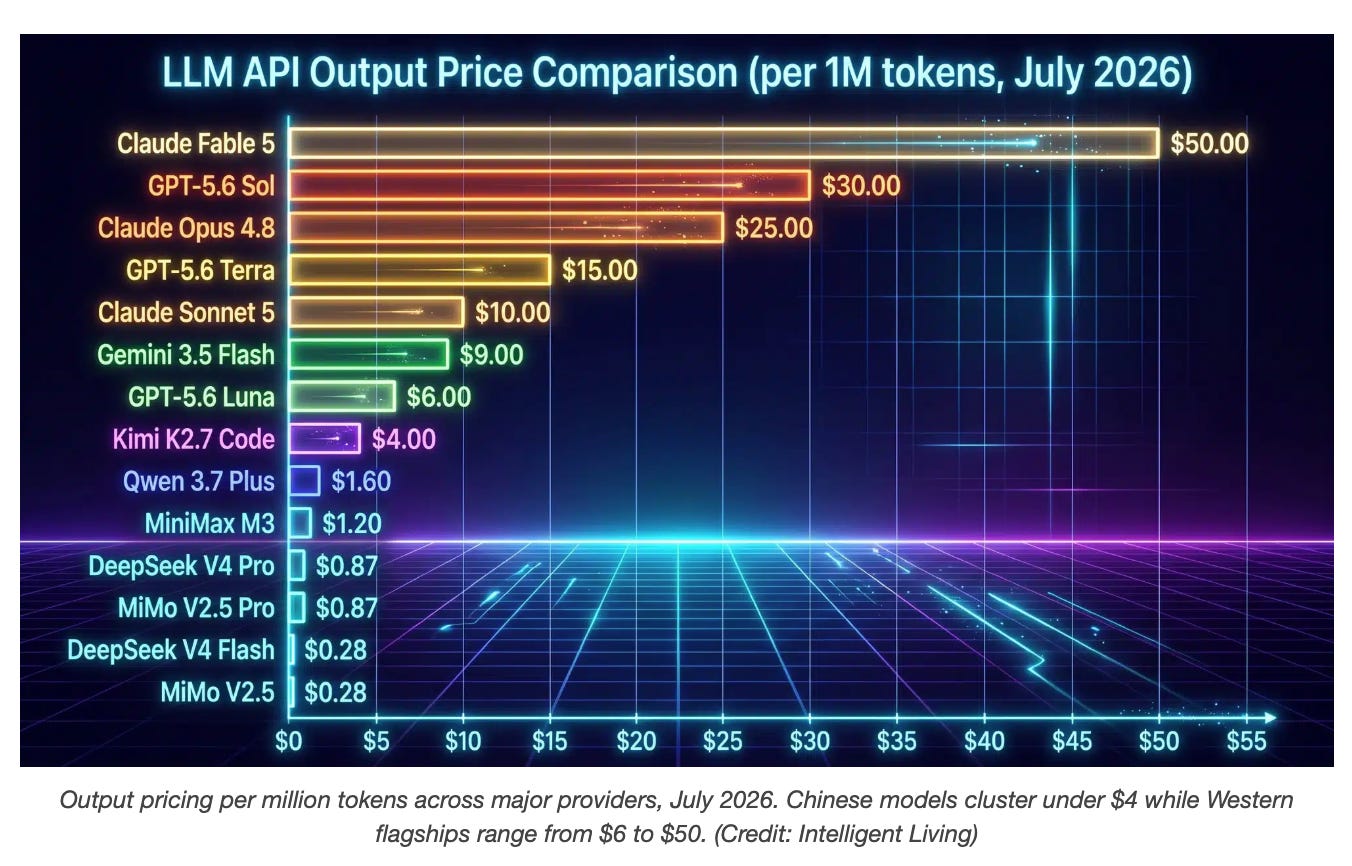
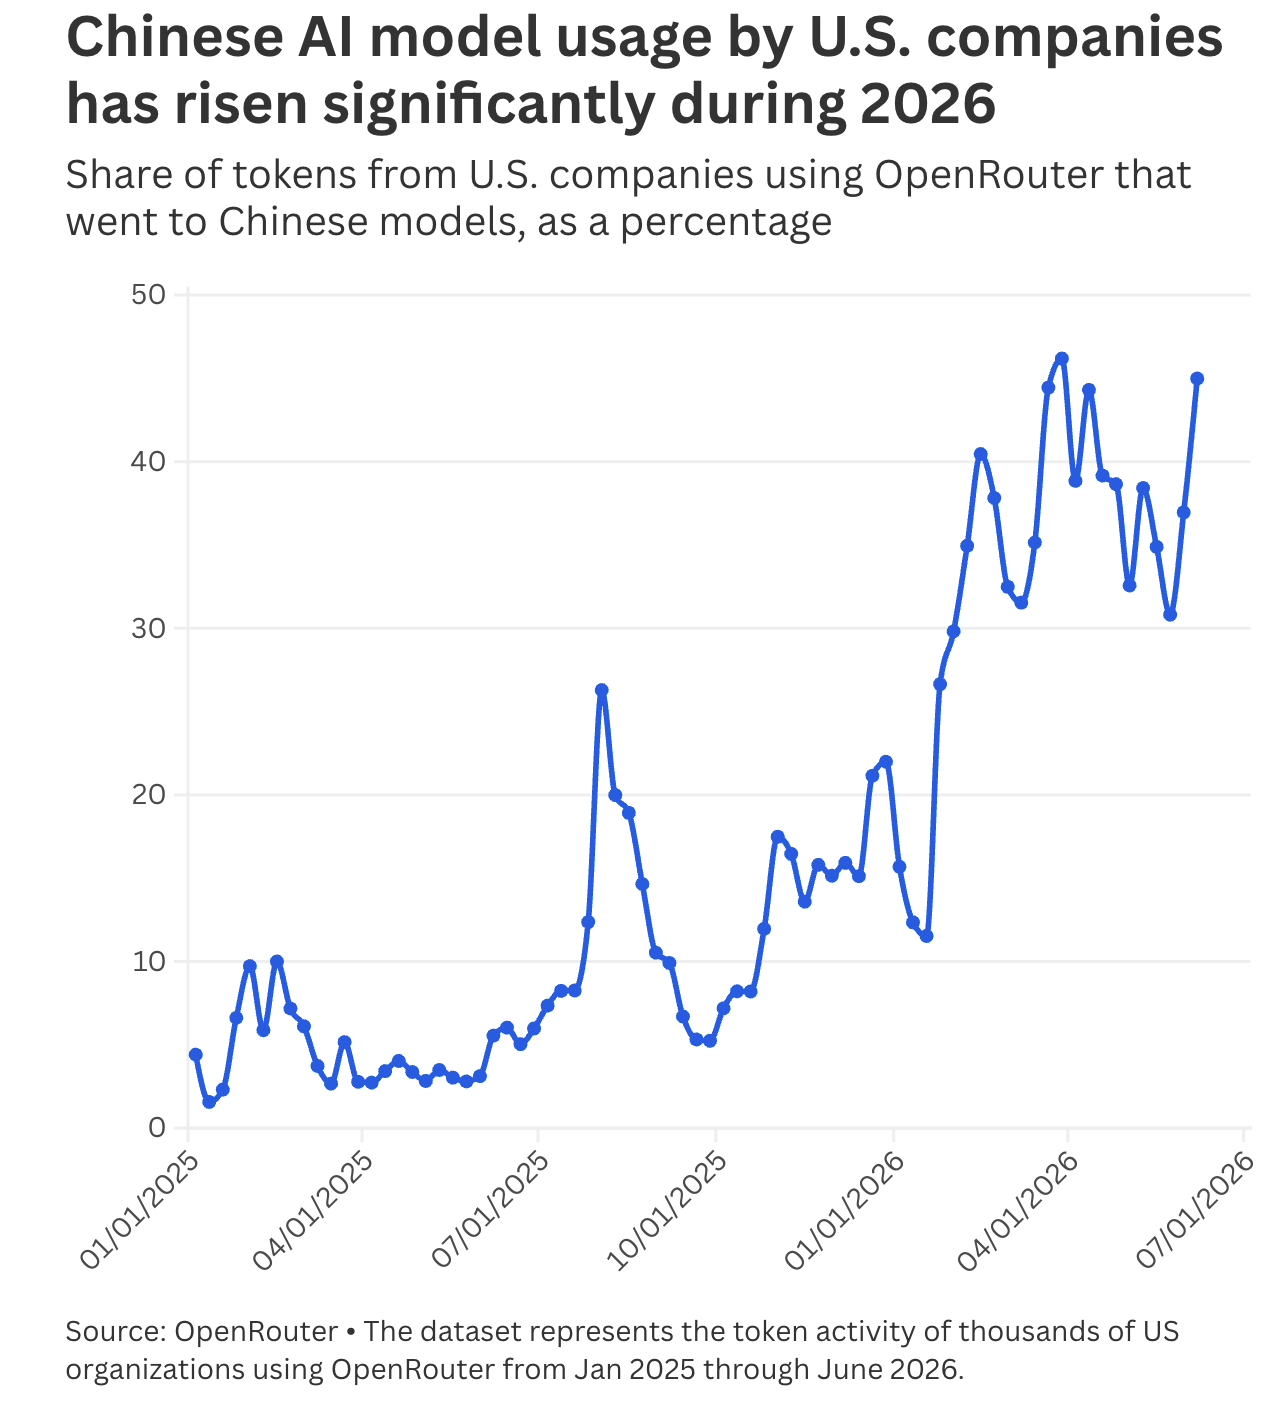
Plenty of companies are already blowing their budgets on tokens. The model makers will likely have to cut prices.
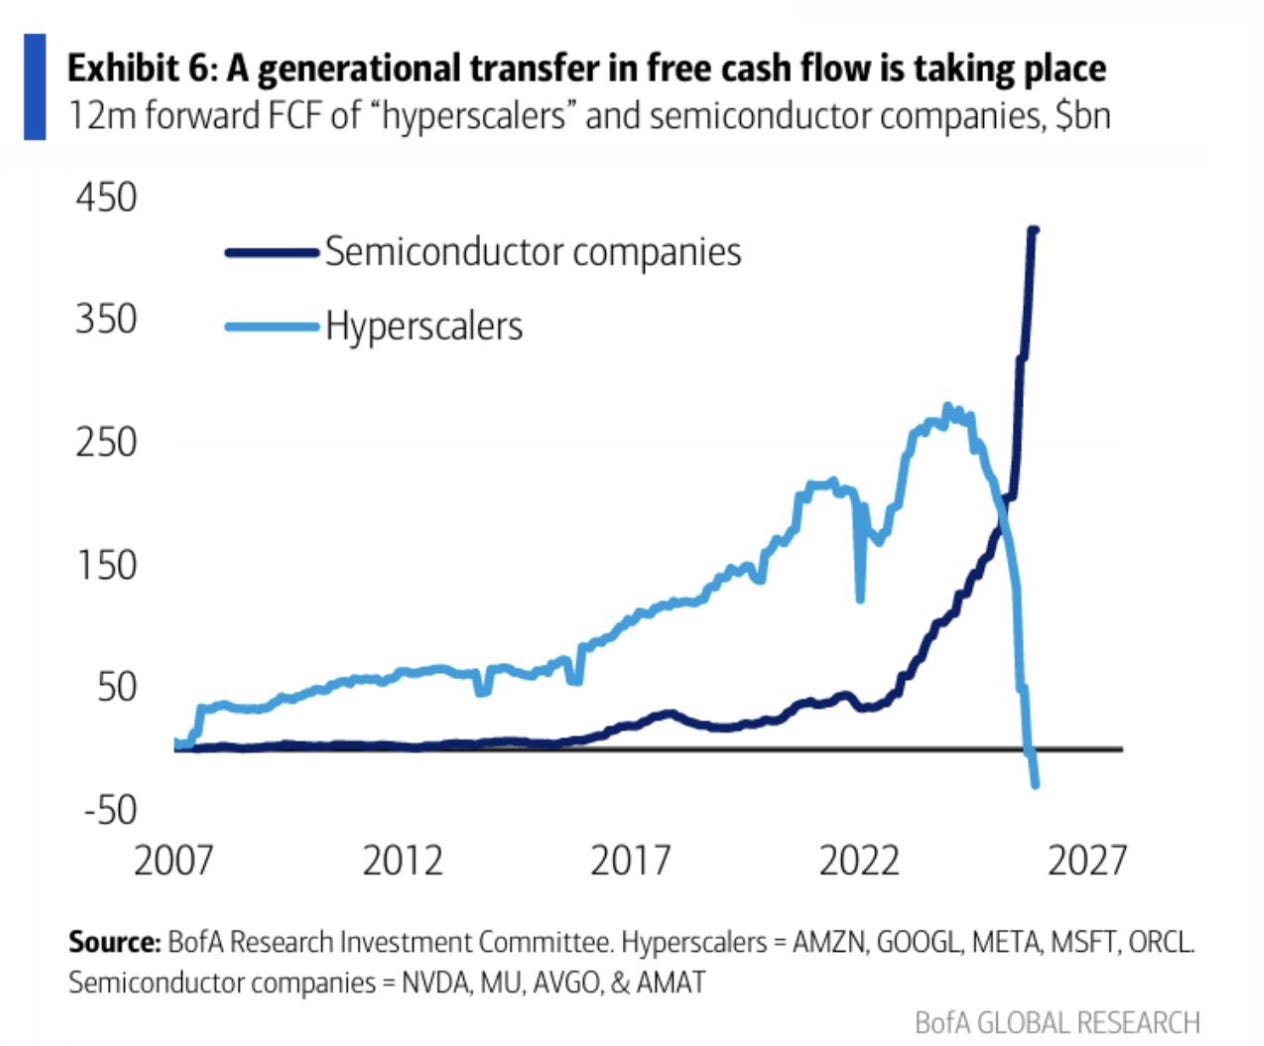
Clearly there’s a free cash flow problem here, and it won’t go on forever.
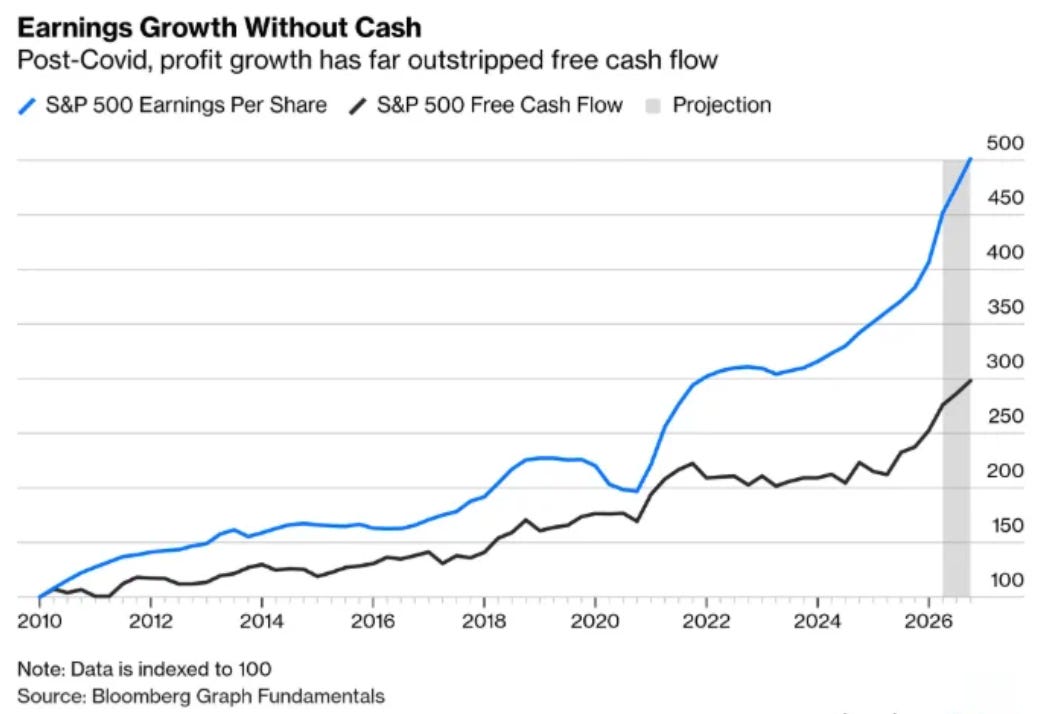
Reported earnings look a lot prettier than owner earnings and free cash flow. Eventually the returns on all this investment have to justify it.
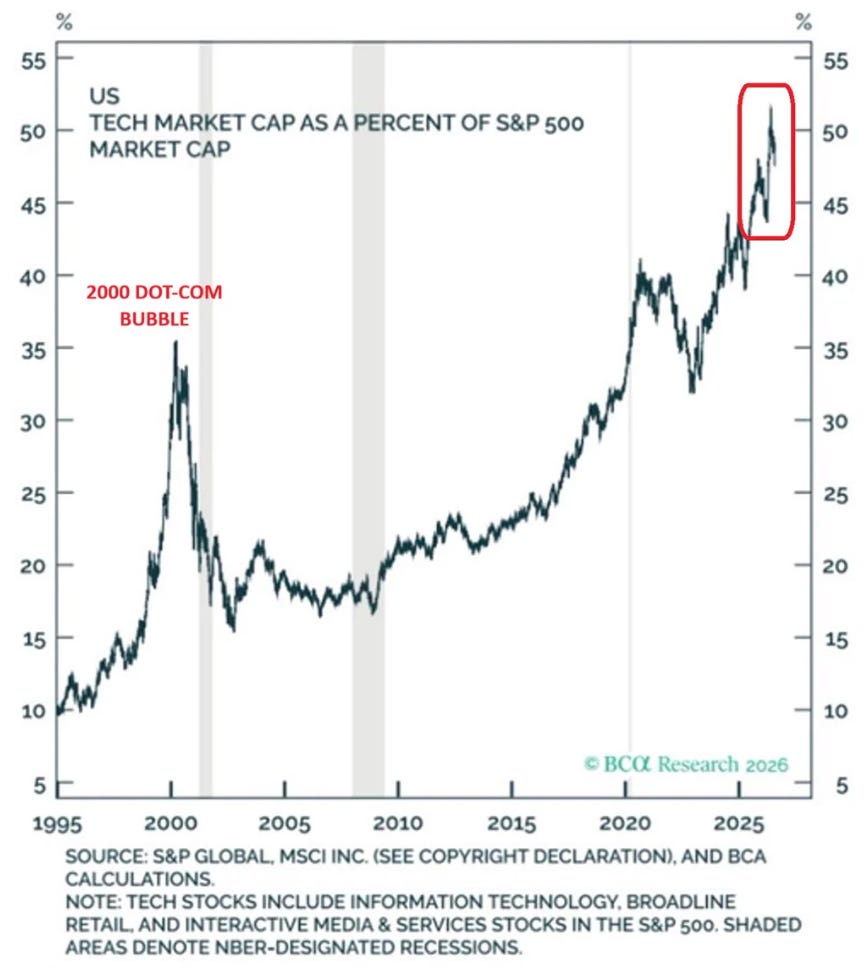
Our market has never been more tech-heavy.
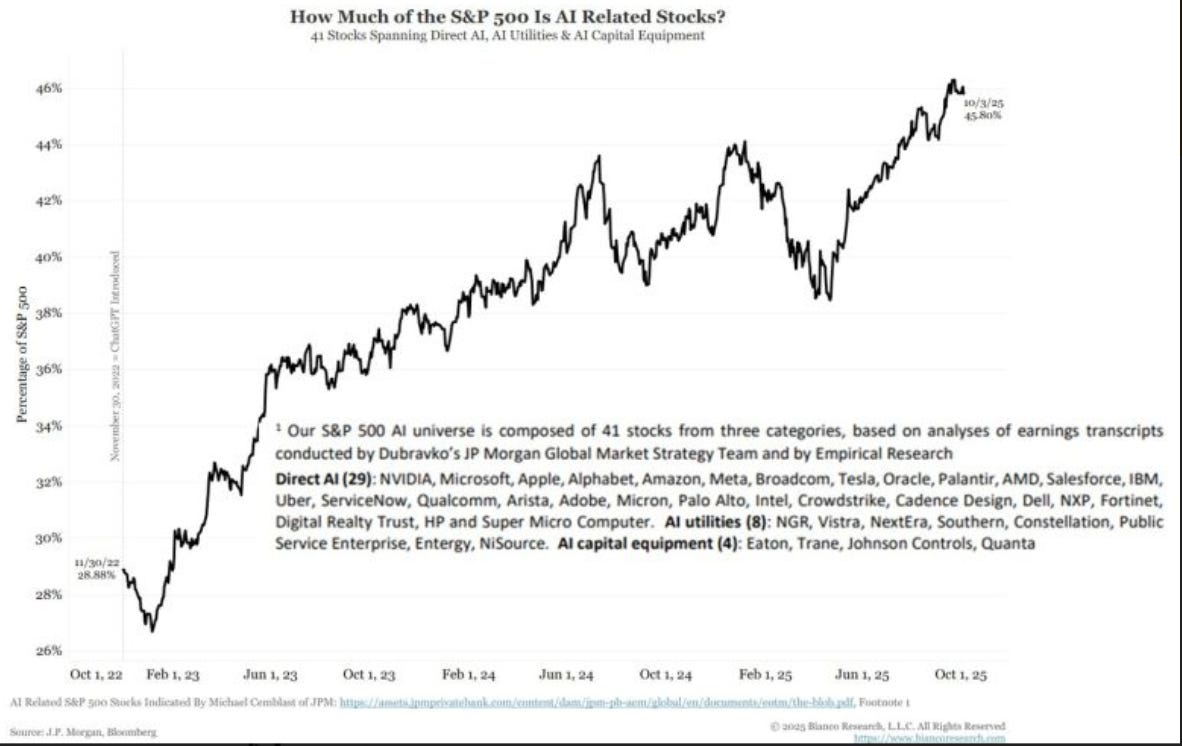
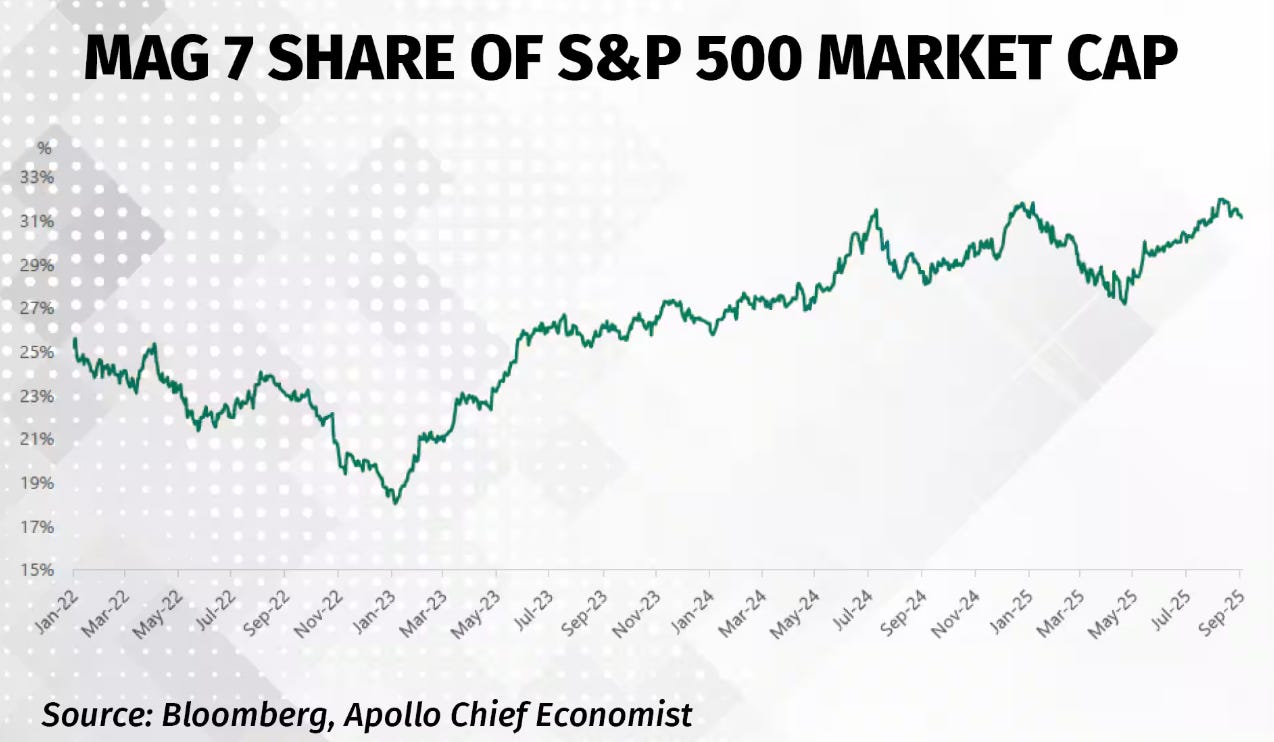
Just seven stocks make up over 30% of the S&P.
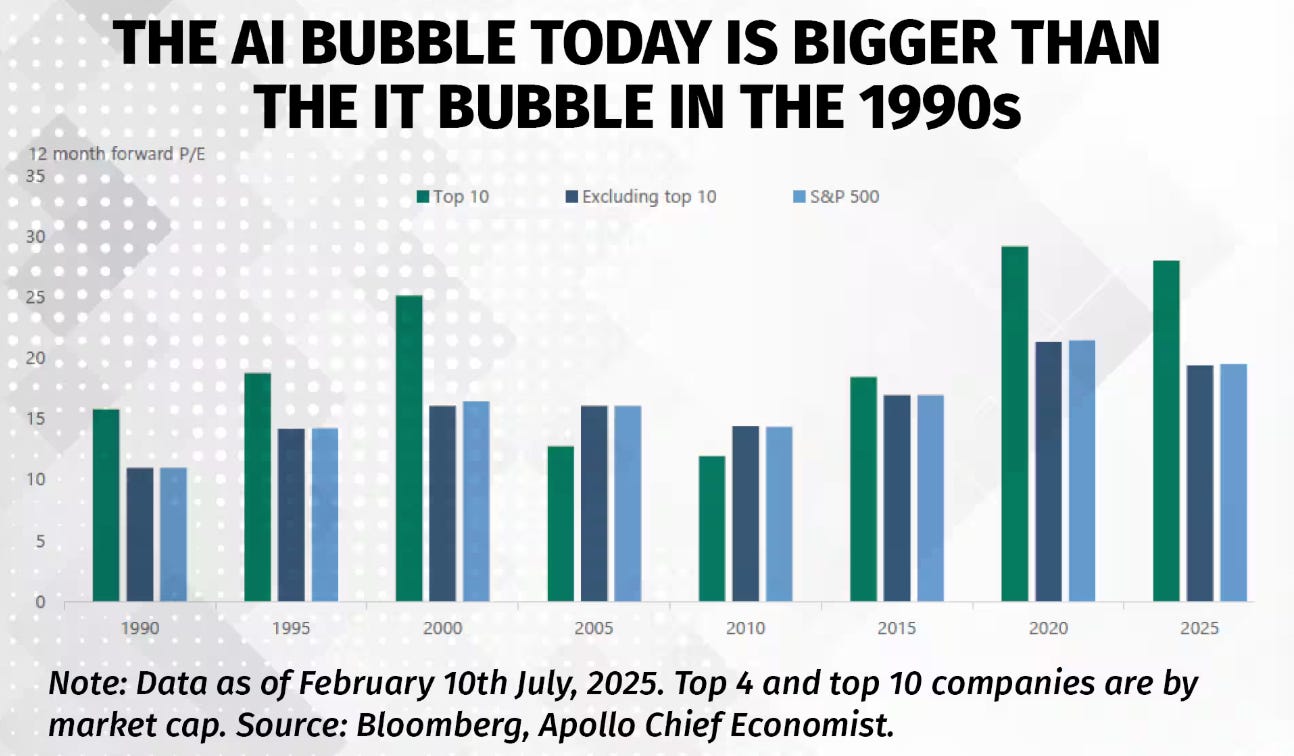
The market is heavily concentrated in a handful of names.
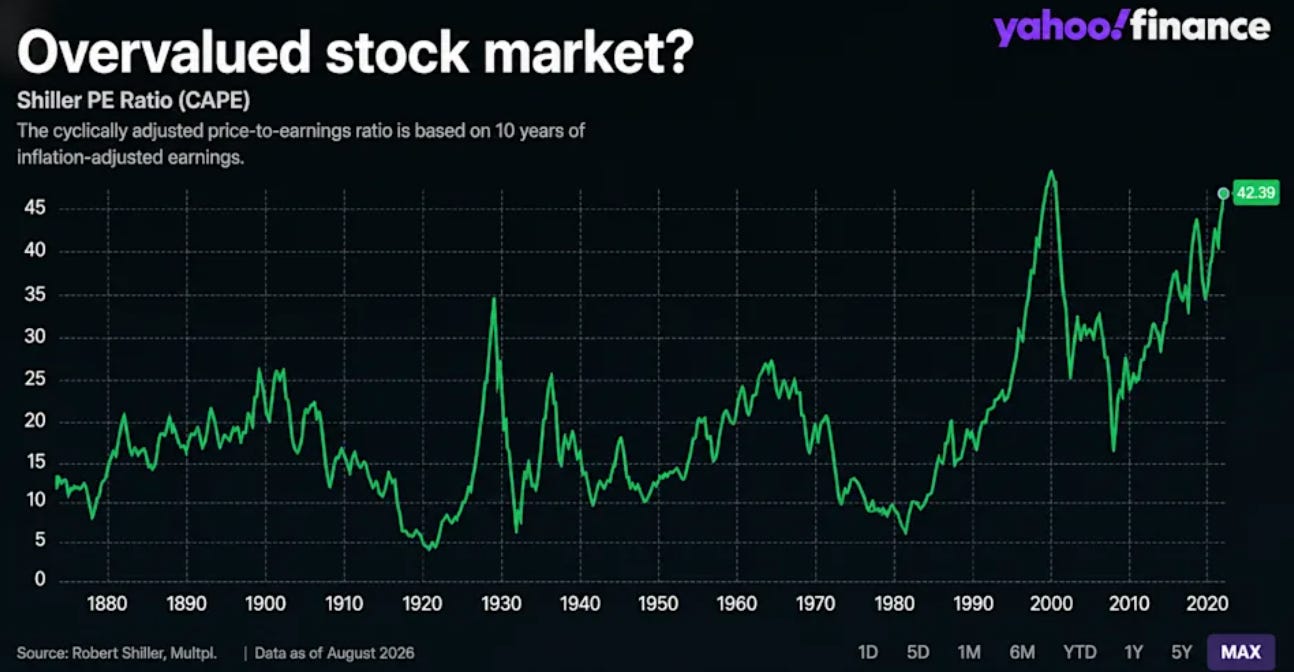
The Shiller (CAPE) ratio is reaching all-time highs.
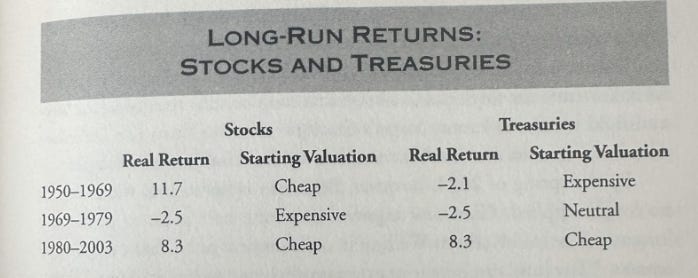
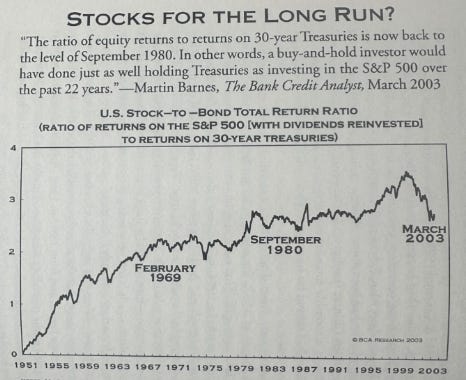
I was surprised, when I looked at bonds over the long run, how well they’ve held up against stocks across many long stretches. If you’d bought the 10-year treasury in 2000, you would have outperformed the market for 18 years. Tell anyone that at the peak in 2000 and they’d have called you crazy.
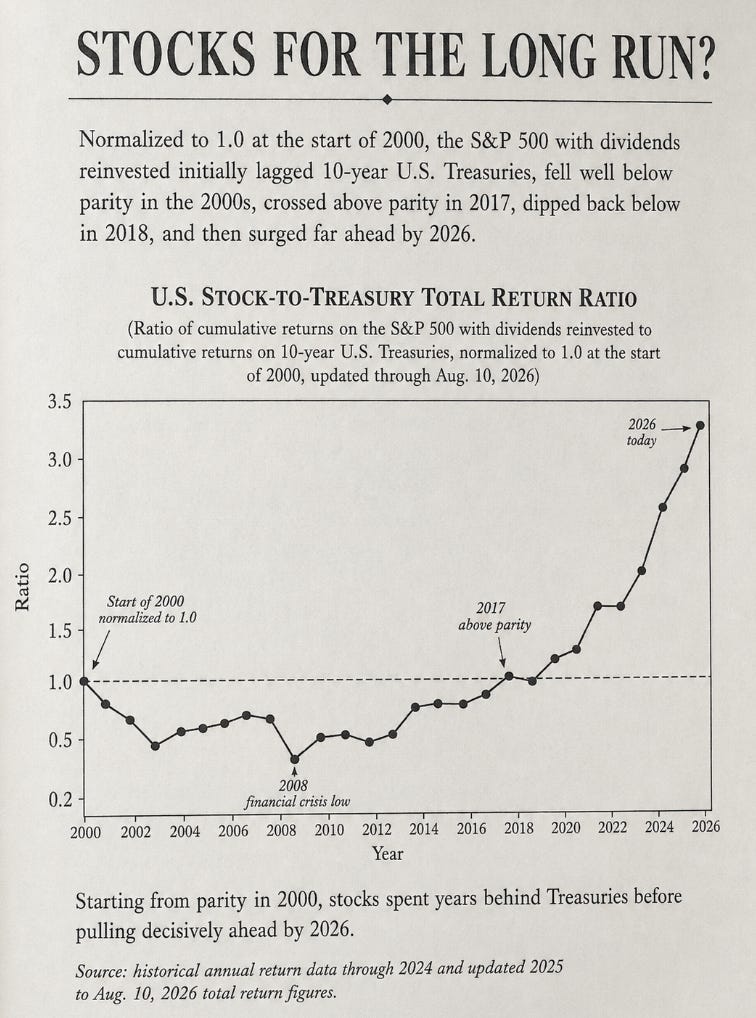
I don’t think the 5% 10-year treasury outperforms stocks for 18 years, but I think it will for many years to come. If it gets to 7 to 9%, it would give the market a run for its money for decades. In 2000 the S&P 500 earnings yield was 3.5% and the 10-yr was 6.6%. Current were around 3.5% and 5%.
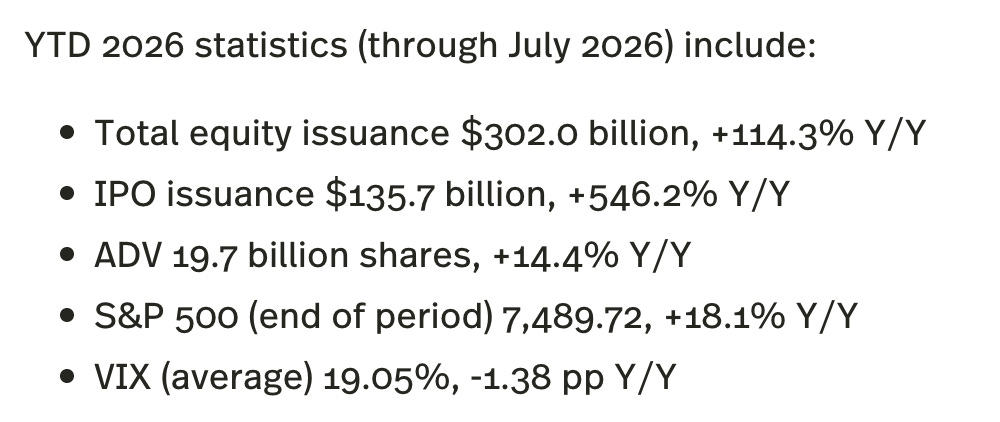
IPOs are heating up. SpaceX went public at over $2 trillion on not much revenue and no profits.
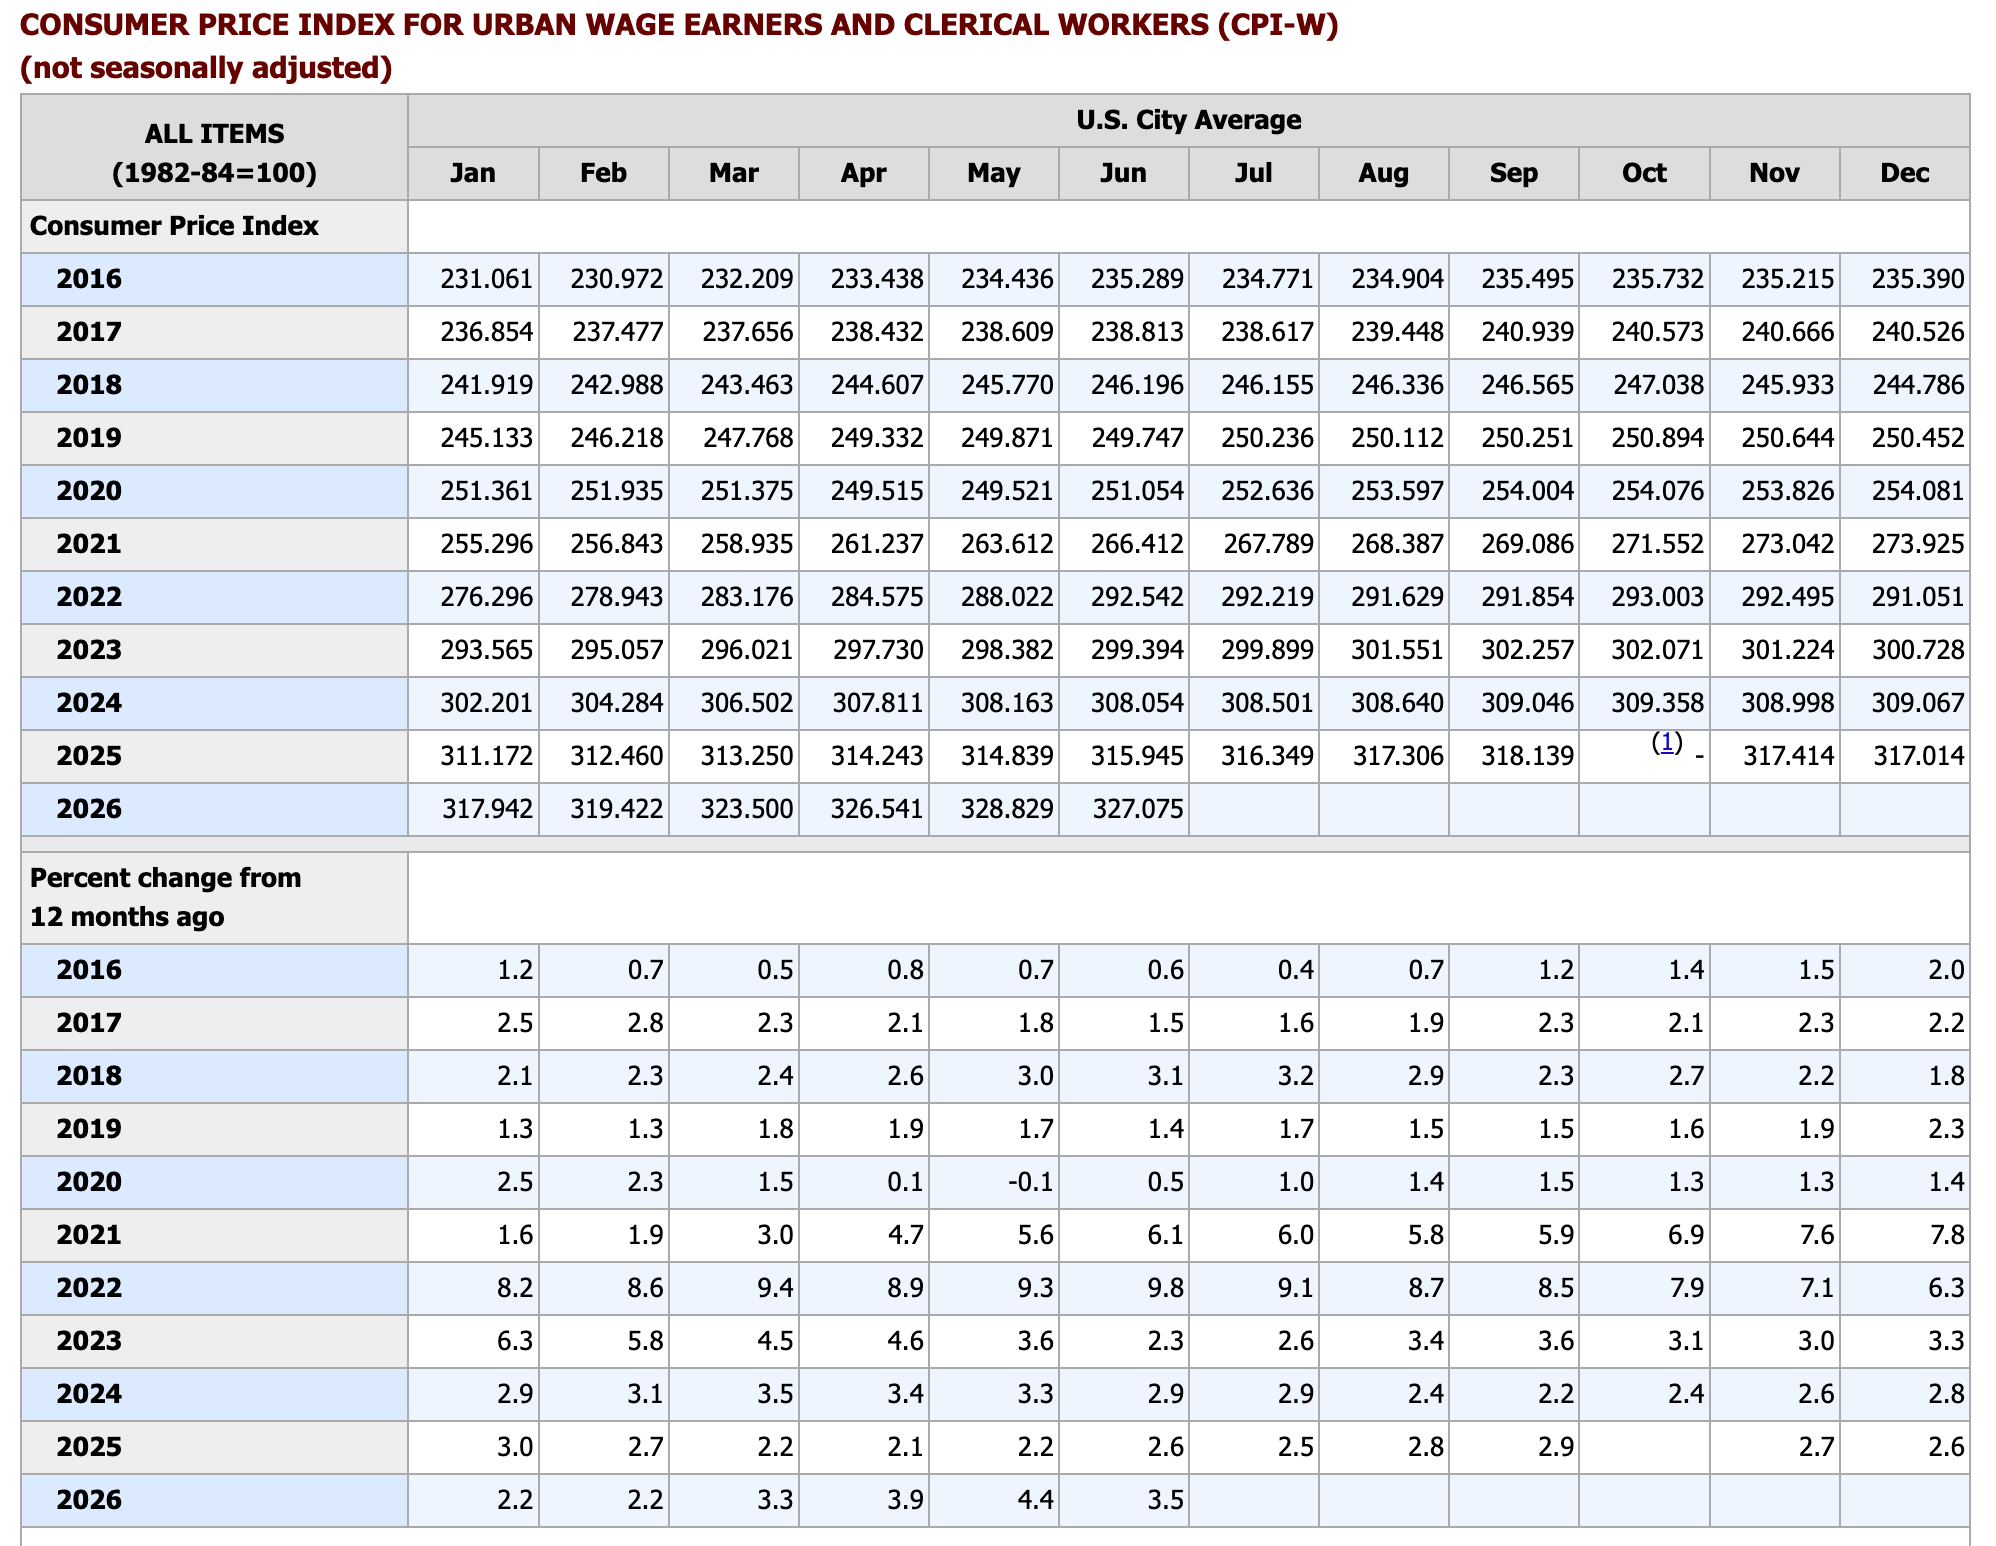
If you’re in high-flying stocks, this is what to watch. If inflation keeps rising, bond yields will keep rising.
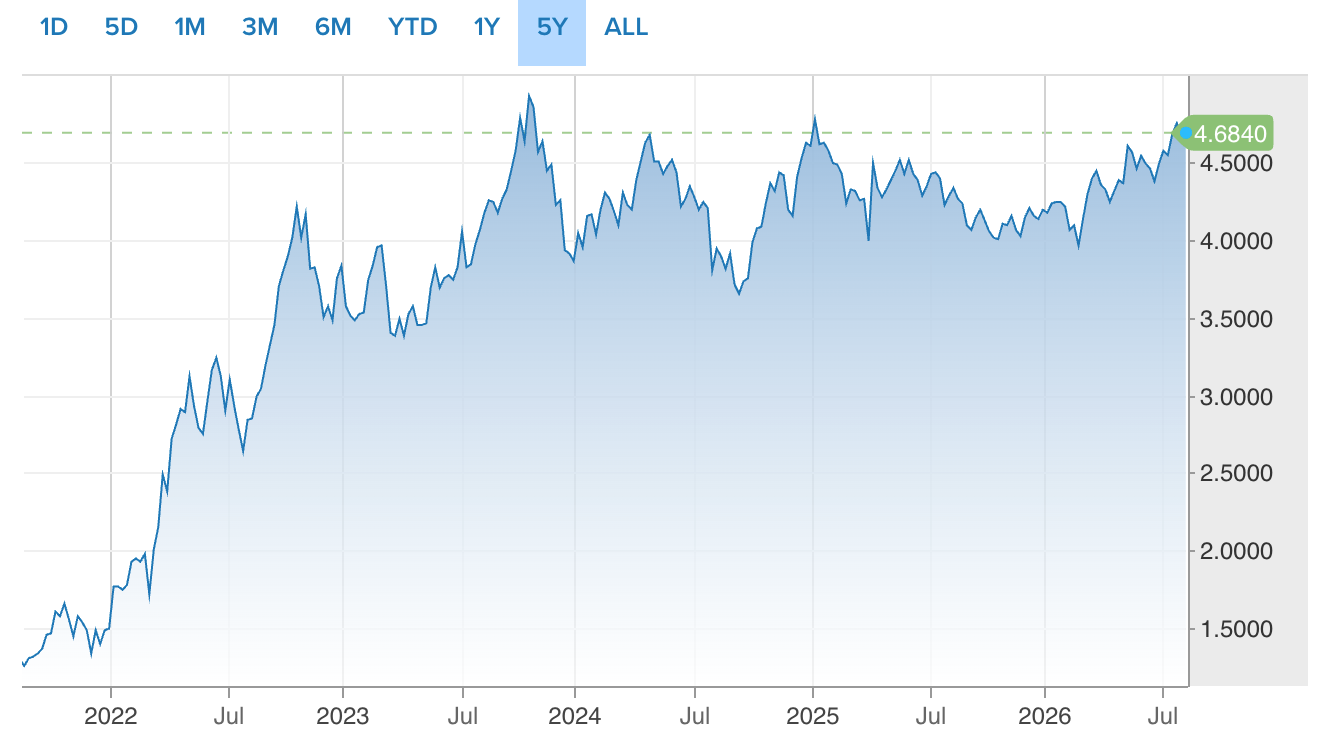
The 10-year treasury. You can see where inflation picked up and rates followed in the last two graphs.
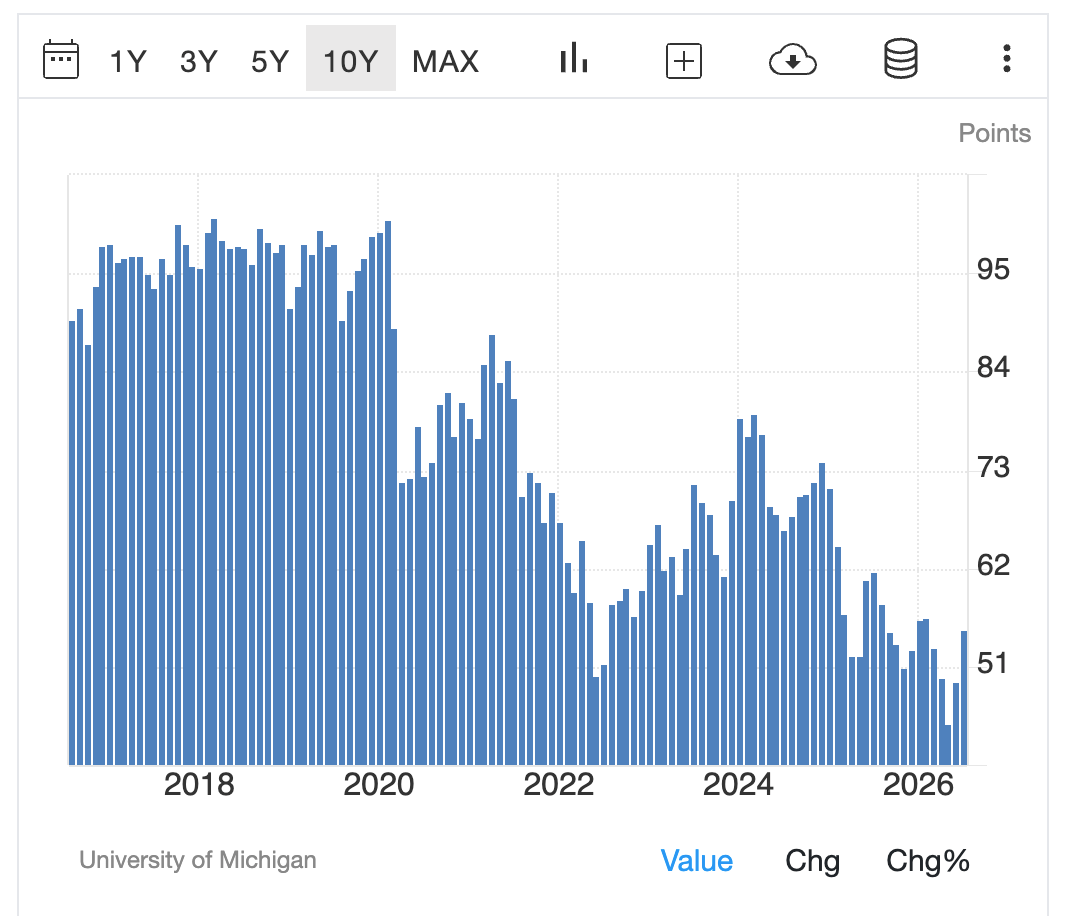
The consumer is hanging in there, but confidence is extremely low.
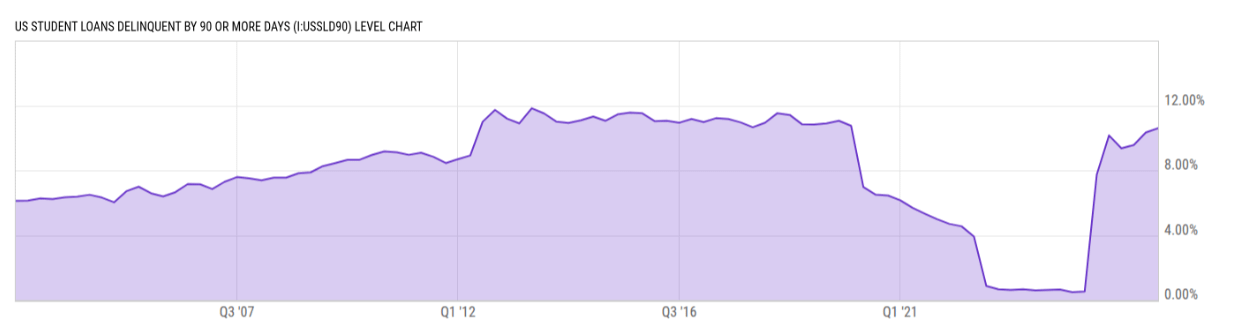
Student loan defaults.
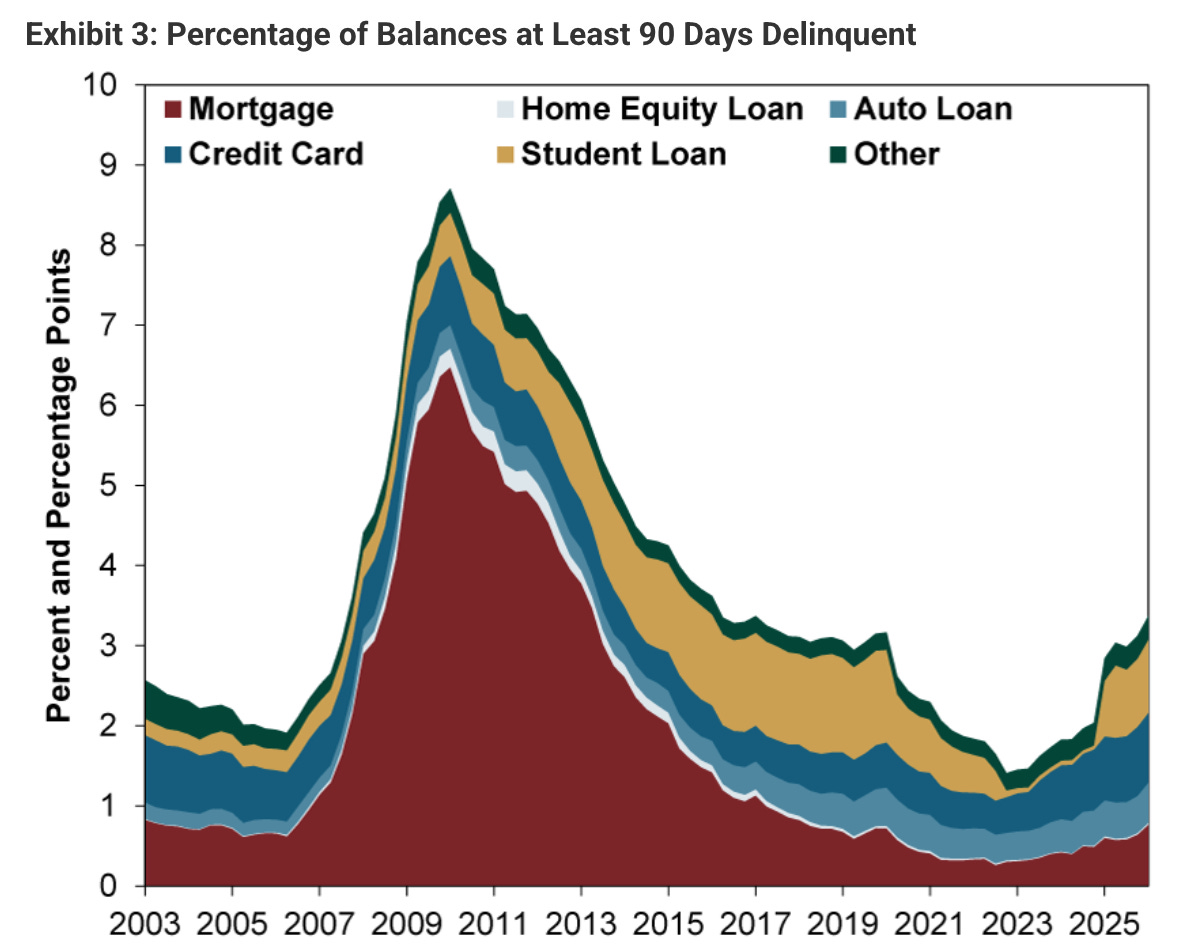
90 day debt delinquencies are picking up.
Conclusion
So, are we in a bubble? My answer is yes, probably. But I won’t waste my breath arguing it with anyone. The Bull could last a few more years but I do think it’s at least dying. I spend my days looking at as many companies as I can and thinking about their future business economics. I’m still fully invested. You can find my portfolio here and the stock I’m currently buying here.
Expectations for future market returns need to be modest. And if you’re nearing retirement and will need the money in the market within the next 10 years, you should seriously consider bonds.
Disclaimer
Investing in individual stocks involves significant risk, including the potential loss of principal. I am not a registered investment advisor or a broker-dealer. Readers should conduct their own due diligence or consult with a qualified financial professional before making any investment decisions. While I strive for accuracy, all data is provided “as is” and is subject to change without notice.
Thanks for the essay. You make a lot of good points with data to back it up. The thing I most loved is the analogy about the food truck. It is so easy to disconnect buying stocks from buying all/part-interest in an actual business. Most people would never buy something with a 3% yield + modest growth when the risk free rate is close to 5%.
I think the market over the past 15-years has been distorted by artificially low interest rates, government support, and creative "financing." It could last forever. And the markets may have permanently changed. But I am not convinced. As someone who traded through the dot-com bust and side-stepped the financial crisis in '07/08, red flags are everywhere today. And a lot of people who have enjoyed success in markets in the past say 5-10 years really haven't been tested yet (Covid being a one-off that recovered quickly).
I remember both in '99 and then in '07 people who had very little experience with markets were telling me about how much money they were making in markets, watching CNBC all-day, and hanging on the Fed's statements. It seems even worse now. Many of them were using borrowed money to invest and thought it was a one-way ticket to wealth. I am a contrarian by nature, so I took the other side of that bet. Maybe I was lucky. But the economic fundamentals did not justify being exposed to markets then. The same rings true today.
Investing successfully today, from current market levels, requires a lot to go right. In my view, the probabilities are lower for the status quo to continue than for a reset. Timing is very hard as you say. But the warning signs are flashing. And many forget that Wall Street analysts, financial commentators, and the media are incentivized to keep the game going--look up Chuck Prince's famous quote in '07 about dancing while the music was playing.
A very long-winded way of saying thank you for putting such a timely and thoughtful note out to your subs. I think if some are having trouble wrapping their head around your thesis, a few things could help.
1. To really think about your food truck analogy.
2. To read and digest the writings of the investors you cite.
3. Look at the relationship to insider sales/buys and run it over time.
4. Ask if you are in the majority or the minority with your current investment thesis. Always being a contrarian obviously doesn't work, but one of Buffett's most insightful maxims is that you cannot buy with the crowd and expect to do well.
Thanks again.
Very well written article, thank you.
I was going to initially make a small counter argument that one could explain today’s higher earnings multiple based on the fact that the investors believe that earnings this time around will be more persistent, meaning, you are happy to pay 20x knowing that earnings yield will stay the same (we are seeing the inverse of that with memory stocks right now, where some mistakenly point ant P/E multiples and scream how cheap the stocks are, without realizing it’s the market showing that these earnings are not persistent).
But then, I remembered that over the last 2-3 quarters most of the net earnings was actually driven by mark-to-market of private investments held by hyperscalers in startups, while free cash flow and op. Margins were under pressure thanks to the increased spend.
So yeah, not looking bright. And I agree that bonds offer attractive alternative right now for those who would usually just buy the index. Because at the end of the day, even if the index trades sideways for a decade, it doesn’t mean that all of the underlying stocks traded the same way. Of course, in a crash scenario everything will fall.