
Why Price Matters When Buying a Stock
My "Equity Bond" mental model, the compounding power of buybacks, and why I chose Crocs over Adobe.

As most of you know, I’m a value investor. I am entirely self-taught, meaning my foundation comes straight from the words of Warren Buffett, Charlie Munger, and Benjamin Graham.
As stock prices have continued their relentless march upward lately, it reminds me of the classic saying: “Everyone’s a genius in a bull market.” Right now, most people are buying stocks without having the slightest idea what the underlying business is actually selling for. They are buying simply because they believe the line on the chart will keep going up.
There is nothing inherently wrong with doing this, but we need to call it what it is: speculating. The danger is that most of these folks genuinely believe they are investing, and by confusing the two, they are playing with fire.
I’ve been writing on Substack for about eight months now. While there are many fantastic finance writers on this platform, I am absolutely shocked by how many articles I read that never once discuss the actual price the business is selling at. The author will do an incredible job detailing what the business does who the competitors are, the current challenges (maybe a little bit too shortsighted a lot of the time) but not ever really getting down to the price of the business unless it’s through a DCF model.
One of the craziest things I see is this constant obsession with a stock’s historical P/E ratio. People will pull up a 10-year P/E chart, see that the multiple has gone down, and conclude that it’s a “good sign” the stock is due to bounce back up.
This has been wild for me to witness because the previous P/E ratio is completely irrelevant to the future price of the business and the stock.
I have occasionally used historical P/E charts in my own writing, but strictly to illustrate a specific divergence, to show how a business’s underlying fundamentals can be getting stronger while the stock price is going down. But if I weren’t writing a newsletter, I would literally never look at or think about a historical P/E chart. It tells you nothing about where the business will be in five to ten years. It tells you how much people overpaid for the stock last year.
I have seen multiple people use Adobe’s (ADBE) previous P/E ratio as a reason to invest as it fell backing up the truck at a 25 P/E, then a 20 P/E, then an 18 P/E, and all the way down. This is crazy to me. Before coming to Substack, I never would have thought smart people would think this way. Again, as a student of Buffett, Munger, and Graham, this was not a concept that ever crossed my mind.
So, today’s article is a demonstration of exactly why price is so critical when making an investment. We are going to use Crocs (CROX) as our primary example to break down how I look at price, and then we will “circle back” (Corporate Lingo…. Gross) to take a quick look at Adobe.
The “Equity Bond” Mental Model
To see why price matters so much, we are going to look at Crocs at two different price points. I originally pitched Crocs on here at $88 back in December, here is that article. I recently trimmed the position at $120 (It was previously 25% of portfolio and now about 12%). For the sake of simplicity in this example, we are going to use round numbers and compare buying Crocs at $80 a share versus buying it at $120.
Let’s assume the company has 50 million shares outstanding and generates $600 million in normalized earnings.
When I evaluate investment opportunities, I try to conceptualize them as a 10-year bond. I don’t calculate this with absolute precision, but Warren Buffett once talked about viewing stocks as “equity bonds” with a variable coupon, and I really took the idea to heart. It’s the primary lens I use to quickly filter through opportunities. As I’ve mentioned in previous posts, I don’t sit down and build this 10-year bond in an Excel model; it’s a mental exercise I do in my head except, of course, when I’m writing these articles to show you the math.
So, let’s look at the “bond yield” of Crocs at these two different prices.
Scenario A: Buying at $80 At $80 a share, with 50 million shares outstanding, you are buying the entire business for $4 billion. If the business generates $600 million in earnings on that $4 billion price tag, it is selling for a P/E multiple of 6.67. More importantly, your initial “earnings yield” (the inverse of the P/E) is 15%.
Scenario B: Buying at $120 Now, let’s look at what happens when the stock price goes up, but the underlying business is exactly the same. At $120 a share, with 50 million shares, you are now paying $6 billion for the entire business. That same $600 million in earnings power now means you are paying a P/E multiple of 10. Your initial earnings yield has dropped to 10%.
When thinking about bond yields, a 15% yield is obviously much better than a 10% yield for the exact same underlying asset. But when it comes to stock prices, there’s a massive double whammy or as Munger would say there’s a Lollapalooza at play.
Crocs is a capital-light business, meaning almost all of its earnings can be returned directly to shareholders in the form of buybacks or dividends. In this case, let’s assume 100% of earnings are used for share buybacks which is what Crocs has a history of doing.
At $80 a share, Crocs can buy back significantly more stock with its $600 million in earnings, which in turn raises the Earnings Per Share (EPS) much faster. Specifically, at a 15% earnings yield, Crocs can retire 15% of its outstanding shares every single year. At $120 a share, that drops to just 10%.
To show exactly how this adds value over a 10-year investment horizon, let’s build out the “bond chart.”
For this model, we are going to assume that revenue growth remains stagnant. Let’s assume net income stays perfectly flat at $600 million for an entire decade meaning 0% underlying business growth. 100% of the EPS growth in this scenario comes purely from the company buying back its own stock. For simplicity, we modeled 15% EPS growth for a 15% buyback but there’s actually a compounding effect that moves the EPS growth to 17.65% similarly with the 10%.
Here is the difference price makes over 10 years:
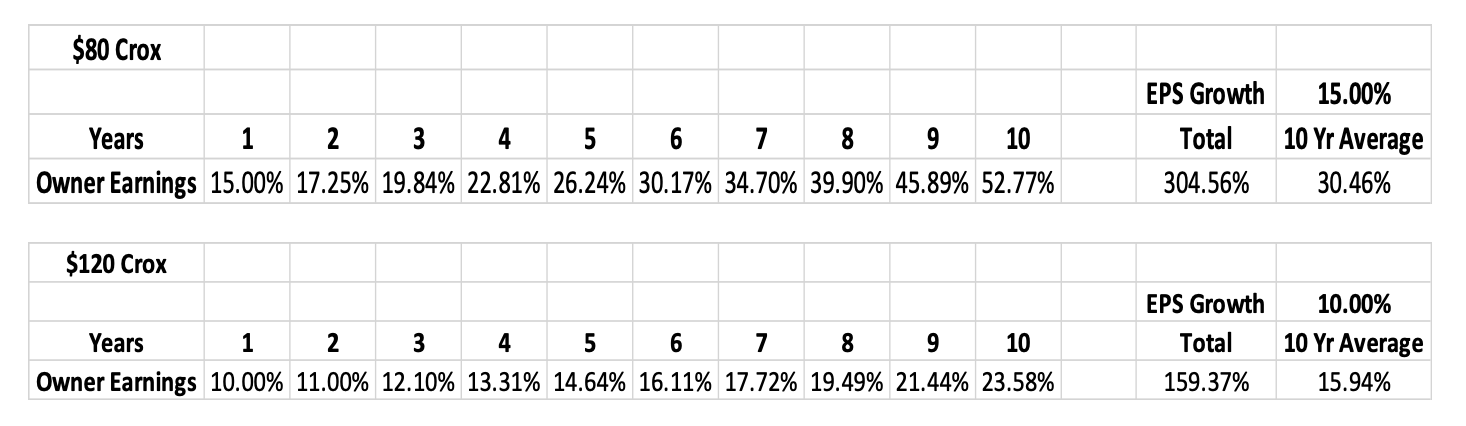
You can see from the charts above that while Crocs at $80 offers “only” a 5% higher initial earnings yield compared to $120, the magic happens in the buybacks. That extra 5% EPS compounding difference turns the $80 Crocs investment into a 30% bond yield, while the $120 entry point yields just 16%. The extra 5% of compounding every year really adds up.
A quick caveat: stock prices are dynamic. They change every day, which affects the exact number of shares a company can actually retire. But this exercise perfectly illustrates why buying Crocs at 6x earnings was such a spectacular opportunity and why buying it at 10x earnings even assuming 0% underlying business growth still offers a satisfactory, but not quite incredible return.
Important note: This is not a Compounded Annual Growth Rate (CAGR) calculation. This is simply a mental exercise to conceptualize a stock as a fixed-rate bond. It does not discount for inflation or apply a discount rate. I don’t sit around building these specific spreadsheets; it just shows the mathematical reality of why buying an equivalent company at 6x earnings is vastly superior to buying it at 10x.
Comparing Adobe
Now, for comparison, let’s look at Adobe (ADBE). We will rewind to January 2026, when it was trading at a 20 P/E.
At $340 a share, with roughly 410 million shares outstanding, you were buying the entire business for about $140 billion. In Fiscal Year 2025, Adobe earned $7.1 billion, giving it a P/E multiple of around 20. Your initial “earnings yield” was 5%.
Historically, Adobe has increased revenue like clockwork. Below is a look at their revenue growth rates over time:

Unlike Crocs, where we conservatively assumed 0% net income growth, let’s assume Adobe continues to grow net income at 10% a year. We will also assume they retire 3% of their shares annually. (Adobe issues a lot of stock-based compensation, so they don’t actually retire the full amount of shares they repurchase in a given year).
These are aggressive assumptions I personally would use much lower net income growth rate for Adobe I like to be conservative, but I thought this illustrates a good point.

Let’s be generous in our model and say 14% EPS growth. Below are the 10-yr bond results.

A few items to note here. First, there is absolutely nothing wrong with a 9.6% bond in the current market, the 10-year treasury is current 4.4%. If Adobe can grow 10% a year for a decade, it will be a fine investment and will likely beat the S&P 500. That is a big “if,” though.
Second, even with 10% revenue growth and 3% net buybacks, it takes Adobe ten years just to catch the initial earnings yield that Crocs offered on day one at 6x earnings. And by the time Adobe reaches a 16% yield, our $80 Crocs investment has turned into a 52% yield! (That assumes Crocs always traded at 6x earnings, which was unlikely, and it’s already 10x again these days).
Opportunity Costs
This example clearly shows why it was so easy for me to pass on Adobe at 20x earnings. It takes one second to figure out that Crocs is my better opportunity. Charlie Munger sums this up perfectly:
“I would argue that one filter that’s useful in investing is the simple idea of opportunity cost. If you have one opportunity that you already have available in large quantity, and you like it better than 98 percent of the other things you see, well, you can just screen out the other 98 percent because you already know something better.” — Charlie Munger
When evaluating Adobe at $340, I could instantly figure out it was an inferior setup to Crocs at $80. I’ll still study Adobe to learn as much as I can about the business in case it ever becomes attractive, but the thought of actively investing in it leaves my mind very quickly.
Crazy Mr. Market
The fun thing about the stock market is that things change rapidly. In just six months, Adobe dropped almost 40% to $210, and Crocs went up almost 50% to $130.
These are fundamentally the exact same businesses they were six months ago. Mr. Market’s mood has simply changed.
Let’s run Adobe’s “bond yield” again. We will keep our aggressive 10% revenue growth assumption consistent. But now that Adobe is trading at a 12 P/E (an earnings yield of 8.5%), their buyback dollars go much further. Let’s assume they can retire 5% of the company a year at these lower prices, resulting in EPS growth of a little under 16%.

You can see that Adobe at $210 (a 12 P/E) is a much more intriguing investment. At $340 per share Adobe was a 9.6% bond at $210 an 18.1% bond. Still, if Crocs were trading at a 6 P/E, it would take Adobe 6 years just to match Crocs’ current yield. However, since Crocs is now at a 10 P/E, the investments are much more comparable, and Adobe’s 10-year “Equity Yield” actually overtakes it.
But remember our assumptions: we are projecting 0% growth for Crocs and 10% growth for Adobe. Forecasting a decade out is usually a useless endeavor. Adobe currently has many competitors trying to tear down the historically very strong castle… will the moat hold up? I’m not sure.
When looking at these two businesses, I am incredibly confident that Crocs can maintain its current $600M earnings power long-term. I can clearly picture the economics of this business ten years down the road.
With Adobe, the picture is much cloudier to me. What does their Creative Cloud business look like in 5 to 10 years? I honestly have no idea. Because of that lack of predictability, even at today’s valuations, I still prefer Crocs. Adobe could easily outperform Crocs if their business keeps humming along, but the odds of a catastrophic loss with Adobe are much higher than I am willing to accept. The risk might be 0.1%, 1%, or 5% I’m not sure.
As Warren Buffett famously said, there are only two rules in investing:
· Rule Number 1: Don’t lose money.
· Rule Number 2: Don’t forget Rule Number 1.
I’ve lost money on exactly one investment in the last six years, so I take this rule very seriously.
Investing is much more than just building spreadsheets and picking the stock with the highest projected number at the bottom. Investing is doing your absolute best to understand the business, assess its economic moat against competitors, and accurately picture the business and their cash flows 5 to 10 years from now.
I can’t stress it enough: I don’t actually sit around making these charts all day. This is simply the mental process constantly running through my head when I compare opportunities.
The point of this article is simple:
Price matters when buying a stock.
Here are my full CROX and ADOBE articles from a few months ago.
Making slippers are easier than wearing the codes of Adobe software.
There are tens of thousand of manufacturers in China are capable to produce the same or better quality slippers than Crocs.